
Pipeline Programs

CGT Companies Tracked

Manufacturing Facilities


The North America cannabis waste disposal market size was estimated at USD 342.8 million in 2025 due to legalization initiatives and is predicted to increase from USD 390.45 million in 2026 due to increasing cultivation practices. The market is expected to grow to approximately USD 1259.73 million by 2035, expanding at a CAGR of 13.9% from 2026 to 2035 due to advancements in waste treatment technologies.
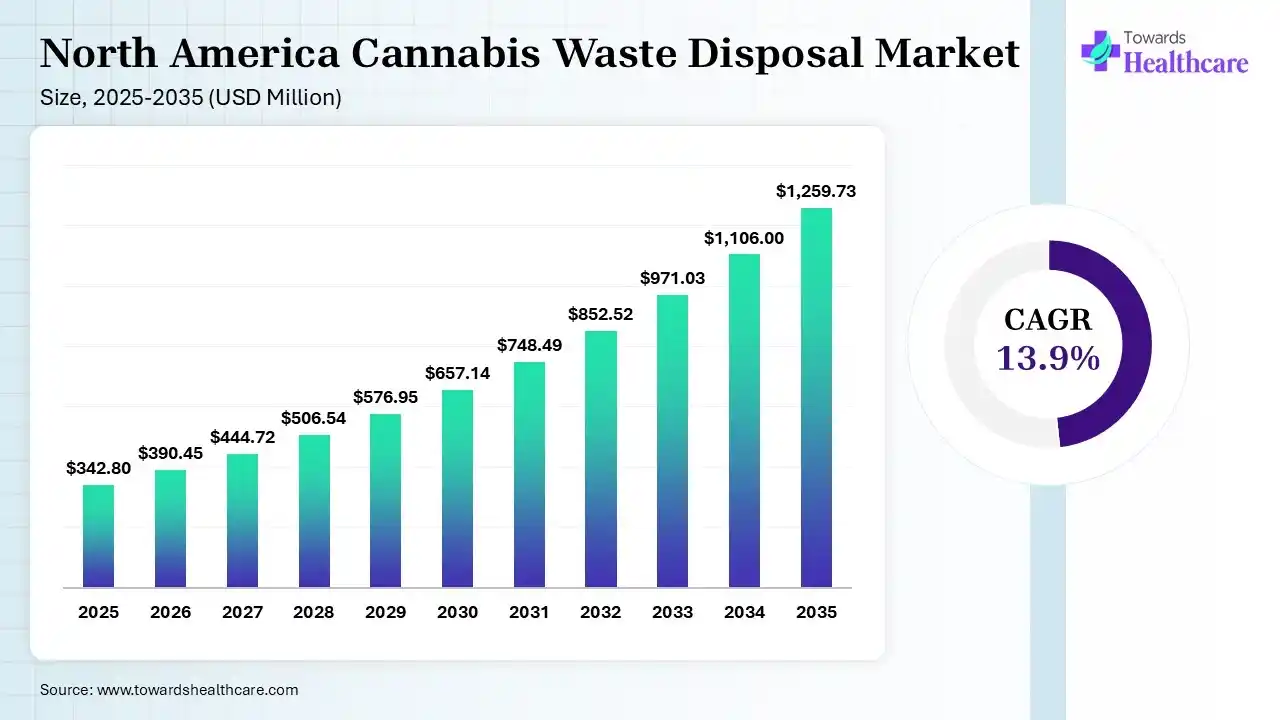
North America cannabis waste disposal refers to the handling, collection, treatment, transportation, and disposal of waste generated by cannabis products during their cultivation, manufacturing, processing, and distribution. They help in waste segregation, tracking, incineration, organic waste treatment, and recycling to ensure regulatory compliance, enhance public safety, and prevent their use in illegal channels.
A shift from compliant waste destruction to a mandatory, budgeted cost center in 2025 has increased legal cultivation and processing of cannabis across the U.S. and Canada, which contributed to a rise in the market size of USD 342.8 million. The growth in regulatory requirements, focus on the prevention of illegal cannabis sales, and environmental sustainability initiatives also enhanced the market growth.
Key Insights
The market size with a $342.8M base in 2025 confirmed the maturation of cannabis waste disposal into a distinct, investable ancillary services category rather than a line item inside general cultivation costs.
Source: Towards Healthcare Database
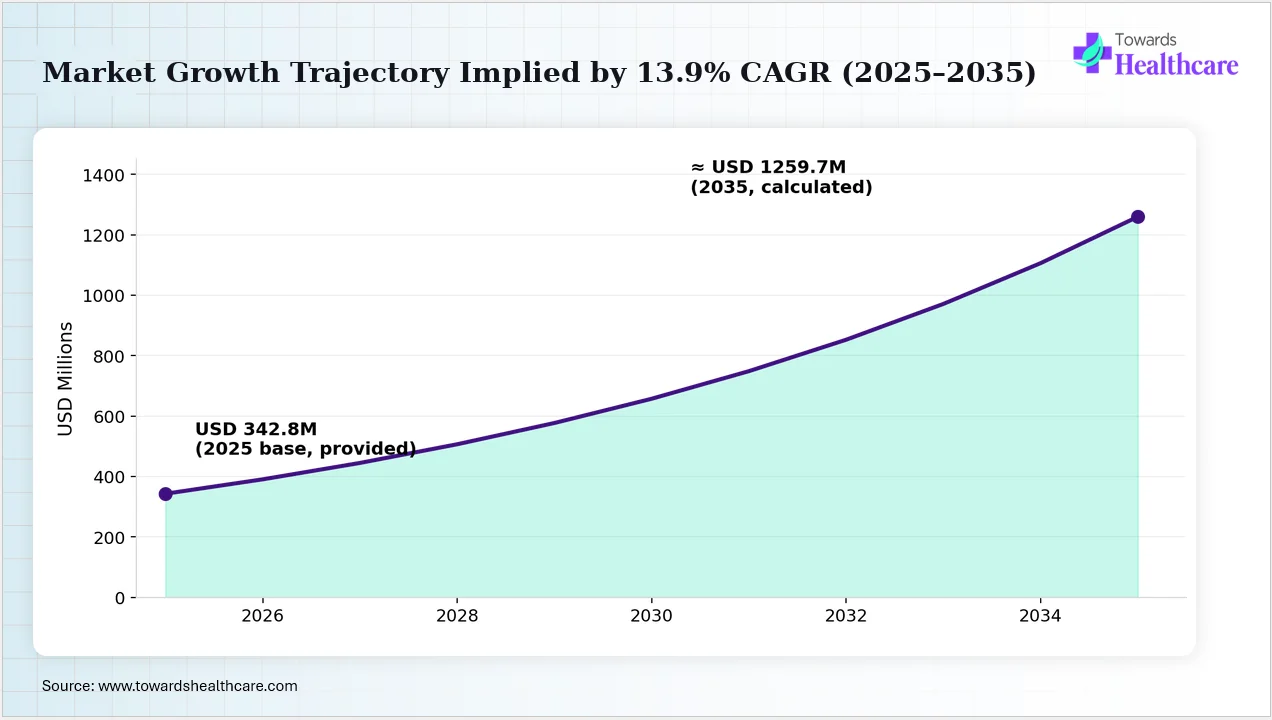
Graph 1: Based on the information I gathered, the market is anticipated to grow from USD 342.8 million in 2025 to 1,259.7 million by 2035. This expansion represents a strong Compound Annual Growth Rate (CAGR) of 13.9% over the ten-year period. This market growth will be driven by expansion of cannabis cultivation, growing cannabis derived products advancements, stringent waste disposal regulations, increasing investments, and innovation in waste tracking technologies.
Key Insights
The market is expected to grow with a sustained CAGR of 13.9% to nearly quadruple over the decade, driving faster growth outpacing most mature segments of the diversified U.S. waste management industry.
Source: Towards Healthcare Database
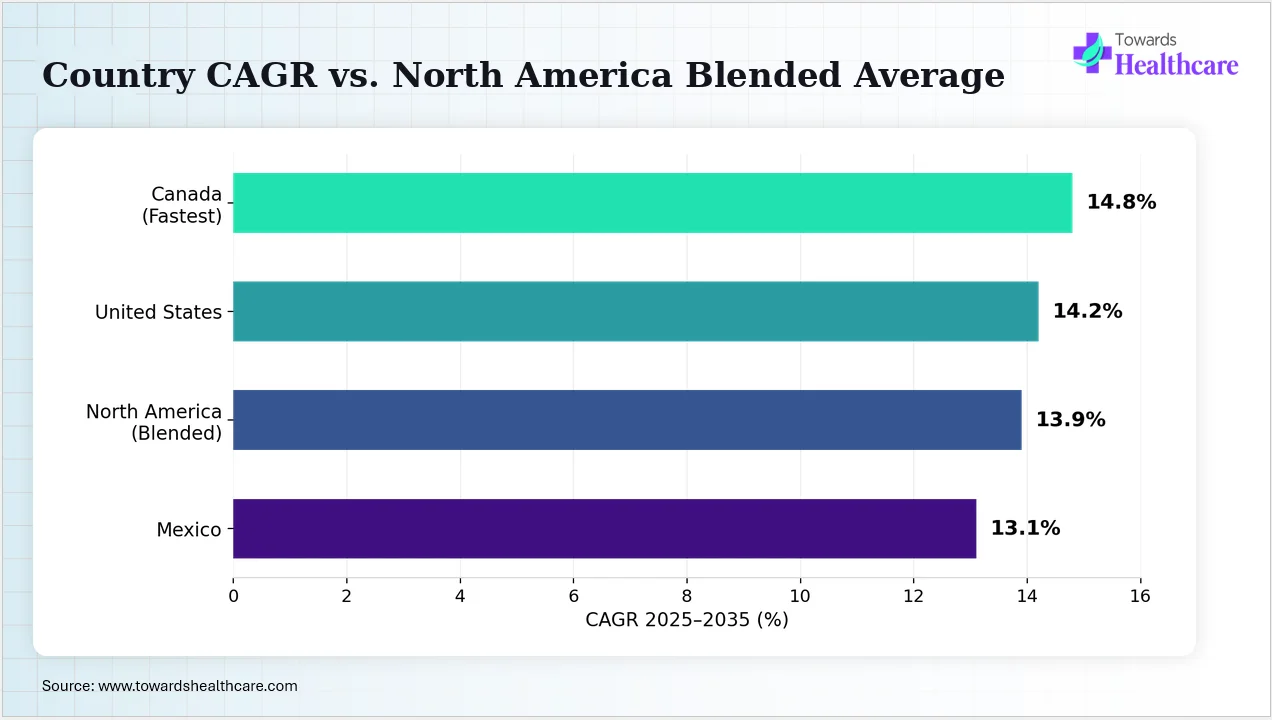
Graph 2: By comparing the growth rate of North America, which is 13.9% CAGR, with its countries, Canada showed the fastest growth with a CAGR of 14.8% due to growing legalization and cultivation of cannabis. When comparing the growth rates with the U.S., it acts as the closest competitor with a CAGR of 14.2%. Similarly, Mexico is expected to grow significantly with a CAGR of 13.1%.
Key Insights
It suggests that the development of cannabis waste infrastructure across Canada is driving its fast growth in the market. Whereas the U.S., consisting of a larger, more mature base, shows steady growth.
Source: Towards Healthcare Database
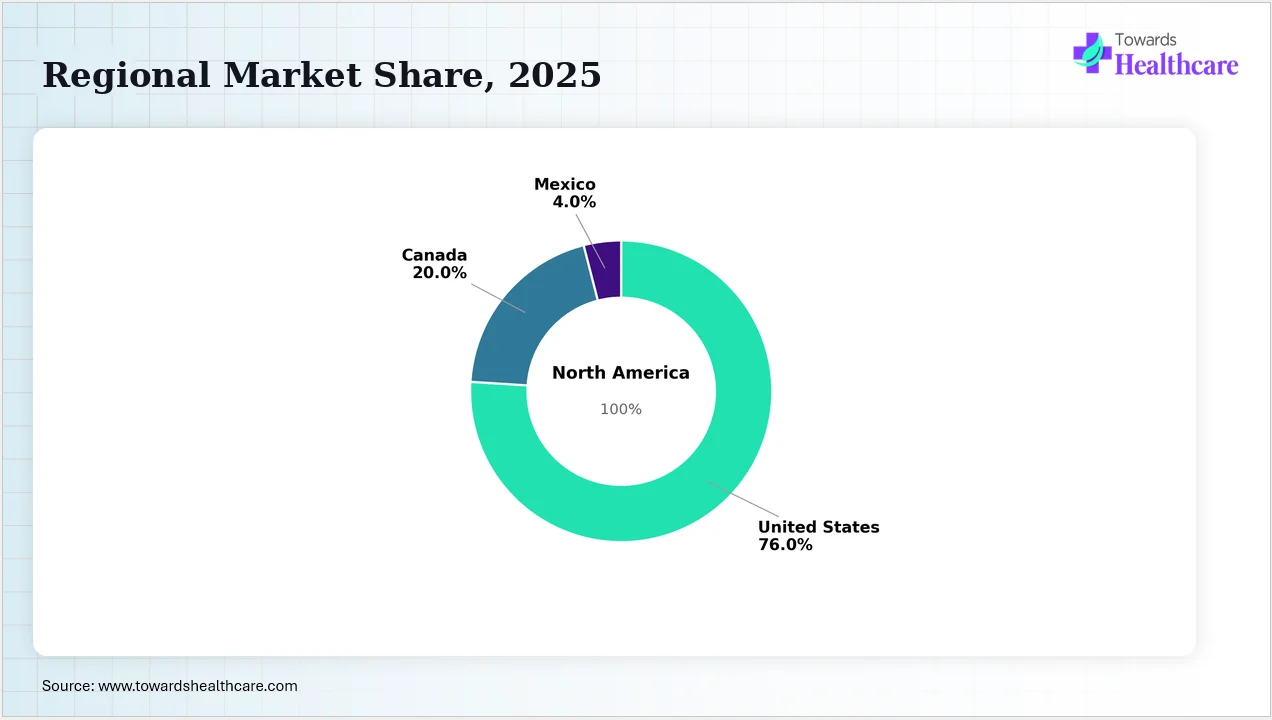
Graph 3: The North America cannabis waste disposal market is divided into 3 countries, that is, the U.S., Canada, and Mexico. The U.S. dominated the market in 2026 with a share of 76.00% and a CAGR of 14.2% due to the presence of a large cannabis market. Canada held the second largest share of 20.00% in 2025 and is expected to expand rapidly with a CAGR of 14.8% during the forecast period, due to legalization trends. Mexico held a share of 4.00% in the market in 2025 and is anticipated to grow significantly with a 13.1% CAGR during the forecast period due to evolving regulations.
Key Insights
U.S. dominated the market with more than three-quarters of regional spend, while Canada contributes as the primary secondary growth engine in the market, as it is expanding rapidly with a meaningful 20% share and the fastest CAGR.
Source: Towards Healthcare Database
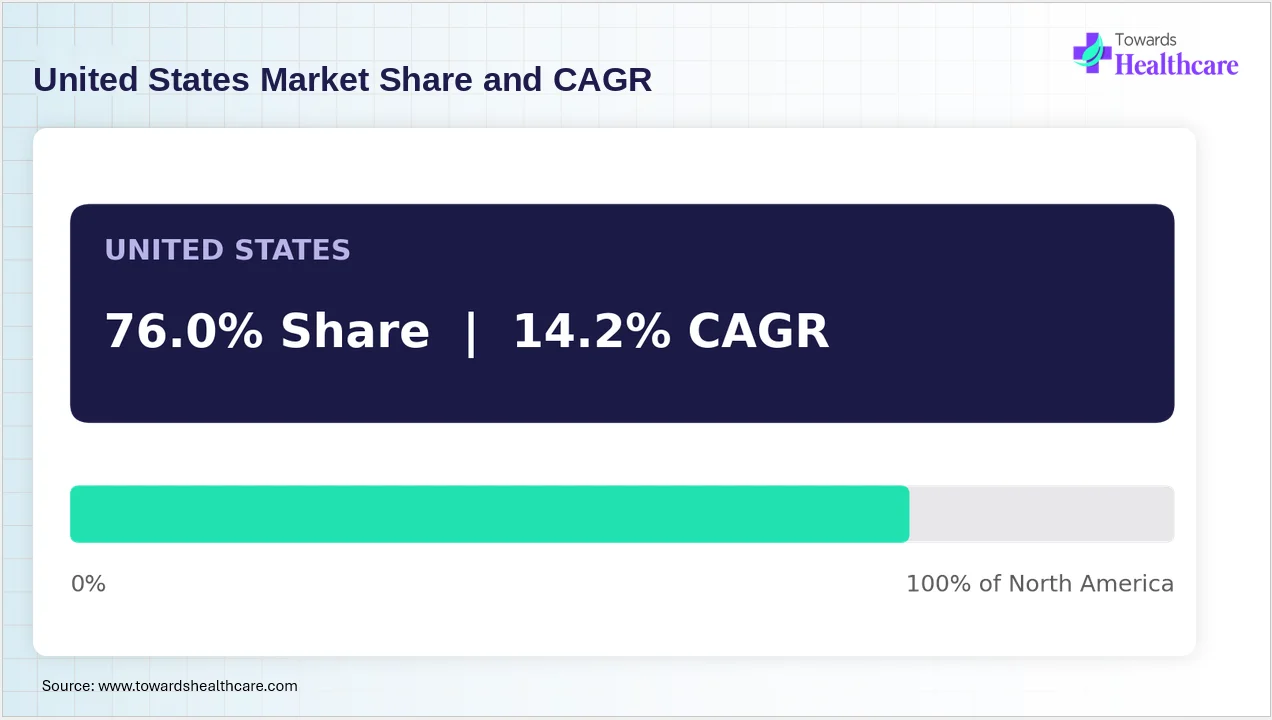
Graph 4: The U.S. registered its dominance in the market with a share of 76.00% in 2025, due to Extensive state-level legalization and strict rendering requirements, which made it compliant with cannabis waste services. The country is expected to show steady growth from 2025 to 2035 with a CAGR of 14.2%, due to increasing cannabis cultivation and processing activities. The stringent regulations increased the demand for certified disposals, and the rise in commercial expansion also sustained its market leadership.
Key Insights
U.S. offered structural dominance, which was driven by additional cultivation licenses added under state programs, which mechanically expanded the compliant-disposal addressable market.
Source: Towards Healthcare Database
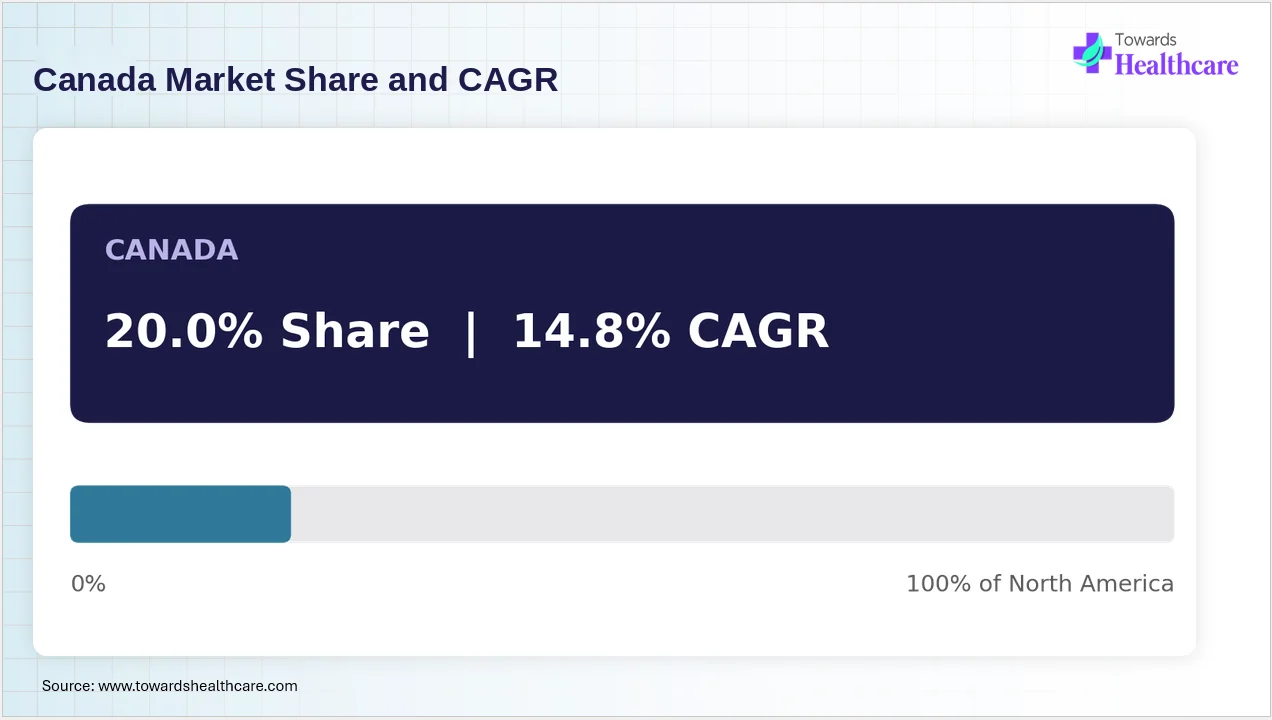
Graph 5: Canada held the second-largest share of 20% of the market in 2025 and is expected to witness the fastest growth with a CAGR of 14.8% during the forecast period, due to rising Nationwide legalization and standardized waste rules, which give Canadian licensed producers a clearer regulatory runway compared to many fragmented U.S. state markets. Rapid expansion of production capacity and growing sustainability investments are also strengthening demand.
Key Insights
Canada consists of a federally unified framework rather than a state-by-state patchwork as seen in the U.S., which supports producers to standardize waste-handling investments nationally, driving market expansion.
Source: Towards Healthcare Database
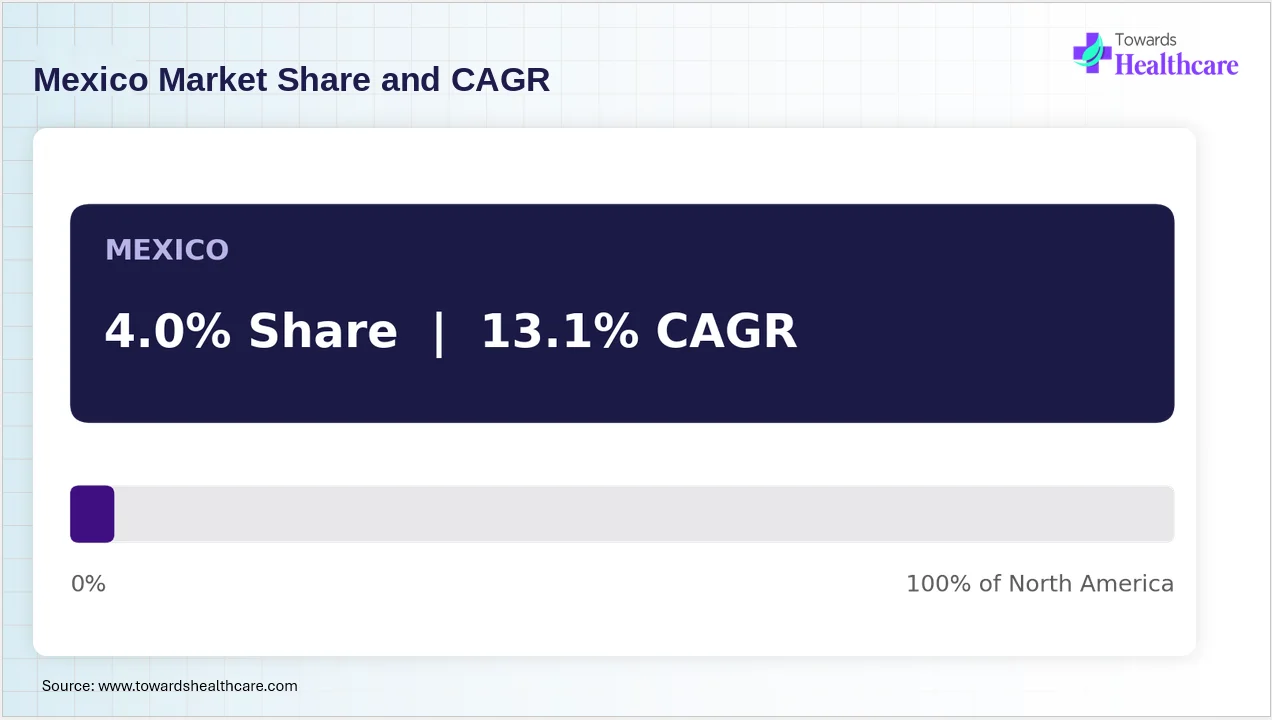
Graph 6: Mexico held a 4.00% share in the market in 2025 and is expected to show notable growth with a CAGR of 13.1% during the forecast period, due to gradual regulatory reform offering long-horizon opportunities as commercial cultivation scales, supporting legal cannabis operations. Growing cultivation infrastructure investment and expansion of disposal services with commercialization are also promoting market growth.
Key Insights
Mexico is expected to show lucrative growth with a smaller share and lower CAGR when compared to other North American countries, due to an earlier-stage regulatory and commercial cultivation environment.
Source: Towards Healthcare Database
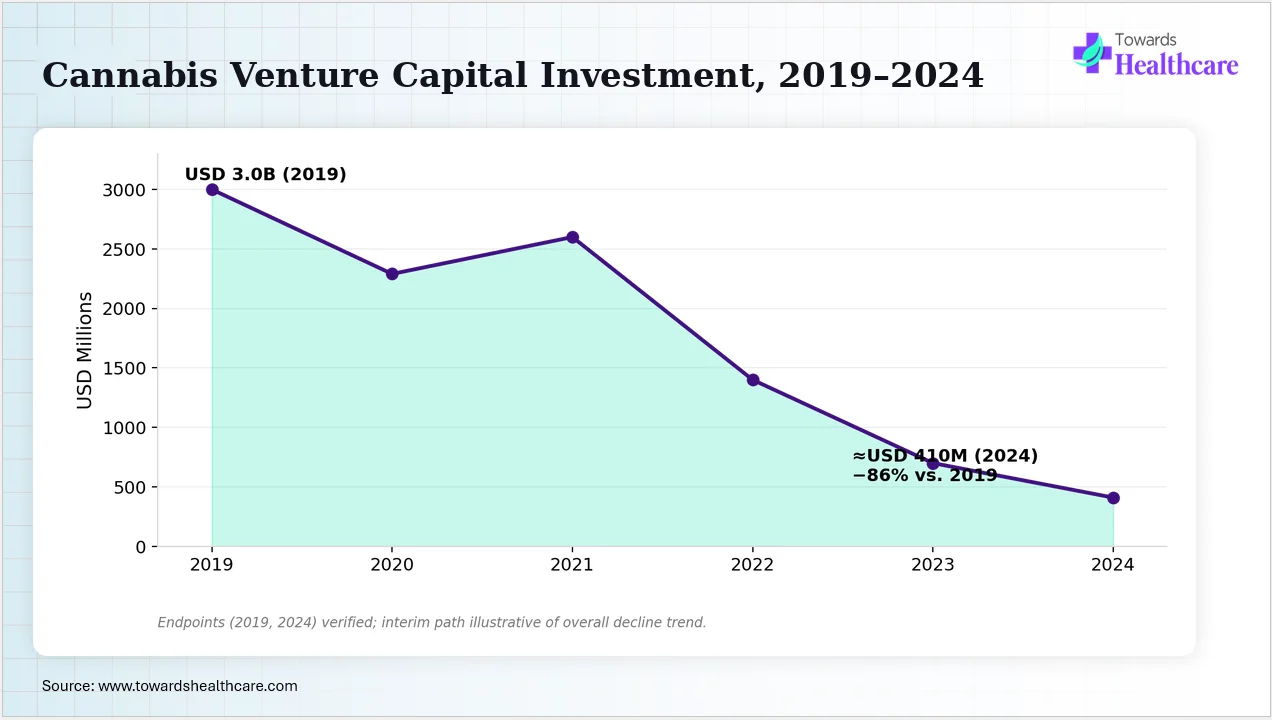
Graph 7: In 2019, cannabis venture capital investment was recorded to be USD 3.0 billion, which showed a decline of 86% in 2024, making it approximately USD 410 million due to higher interest rates and profitability concerns. Additionally, 2024 reported a total cannabis capital rise of approximately USD 2.2 billion, out of which 91–94% was debt rather than equity.
Key Insights
In the cannabis sector, the waste and compliance service providers are highly financed through debt rather than venture equity, which results in operators with predictable, contract-based recurring revenue.
Source: Towards Healthcare Database
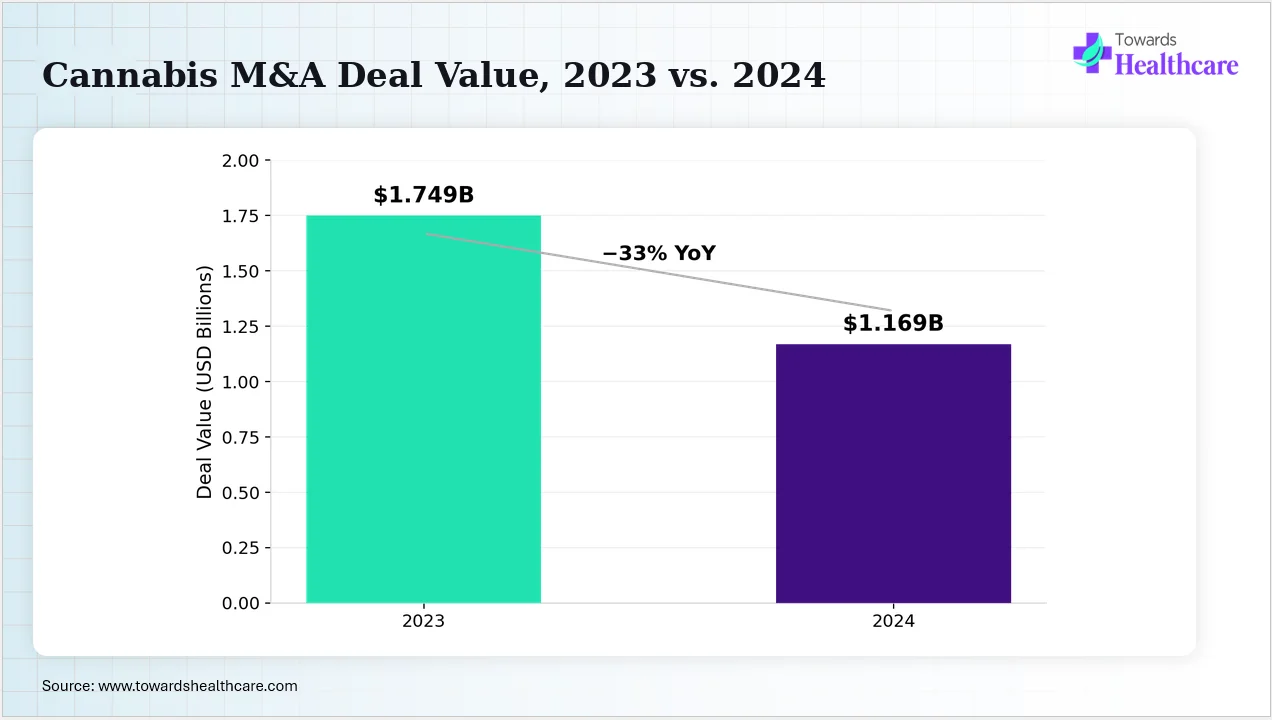
Graph 8: Based on the research findings and my interpretation, cannabis M&A deal value dropped to $1.169B from $1.749B in 2024. In 2023, cannabis M&A deal valued around USD 1.749 billion, whereas it was reported to be USD 1.169 billion in 2024, denoting a decline of 33%, where the average deal size in 2023 was noted to be USD 20.4 million due to falling aggregate deal value alongside a rising deal count, pointing to smaller, strategic bolt-on transactions. Pricing pressure and limited access also reduced their deal value.
Key Insights
It suggests that waste and compliance service providers should shift toward smaller, strategic deals to create acquisition opportunities for multi-state operators seeking vertically integrated platforms.
Source: CBHD News
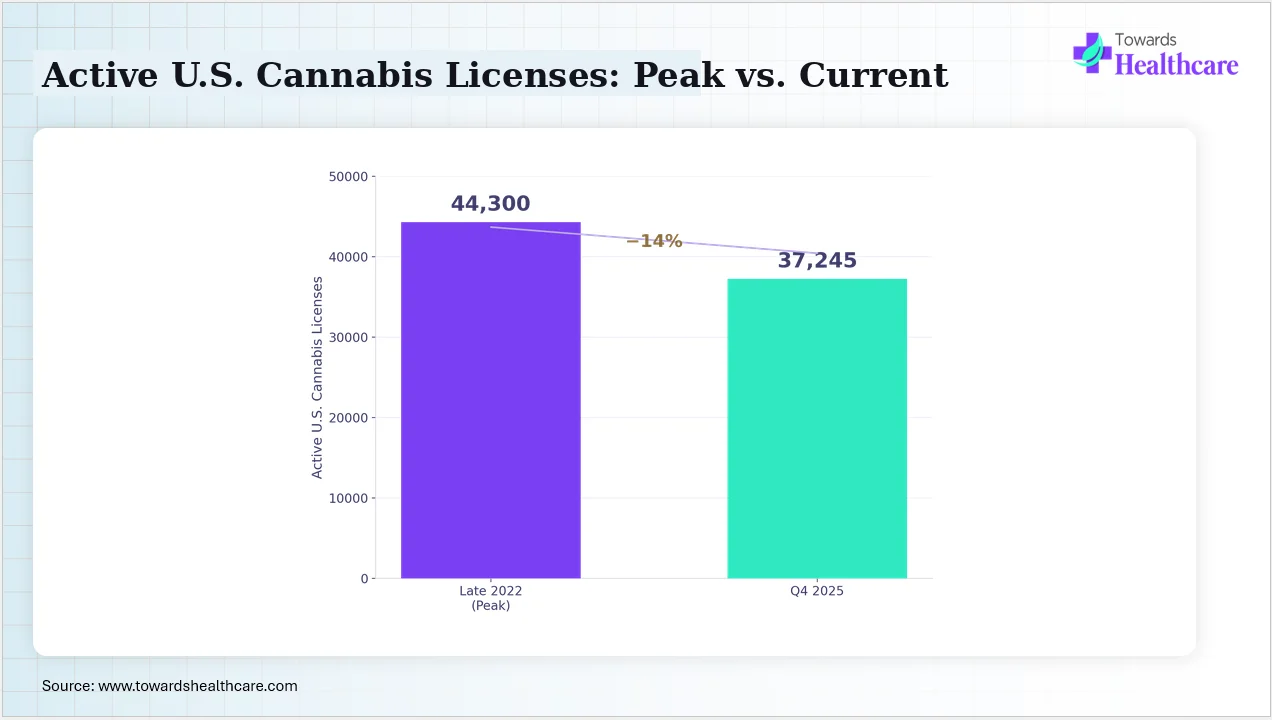
Graph 9: The graph represents a decline in cannabis licenses across the U.S., where late 2022 experienced active cannabis licenses around 44,300 while Q4 2025 showed a 14% decline to 37,245. Active U.S. cannabis licenses noted in late 2022 were approximately 44,300, which dropped to approximately 36,665–37,824 in Q4 2025, indicating a rough decline of 14%. Additionally, cultivation permits also declined by 8.6% that is to 17,013 from 18,630 year-over-year.
Key Insights
The reduced number of larger cultivation operations leads to higher volumes of cannabis waste generation, increasing the demand for professional waste contractors, which help in improving route density and contract economics for waste haulers.
Source: Towards Healthcare Database
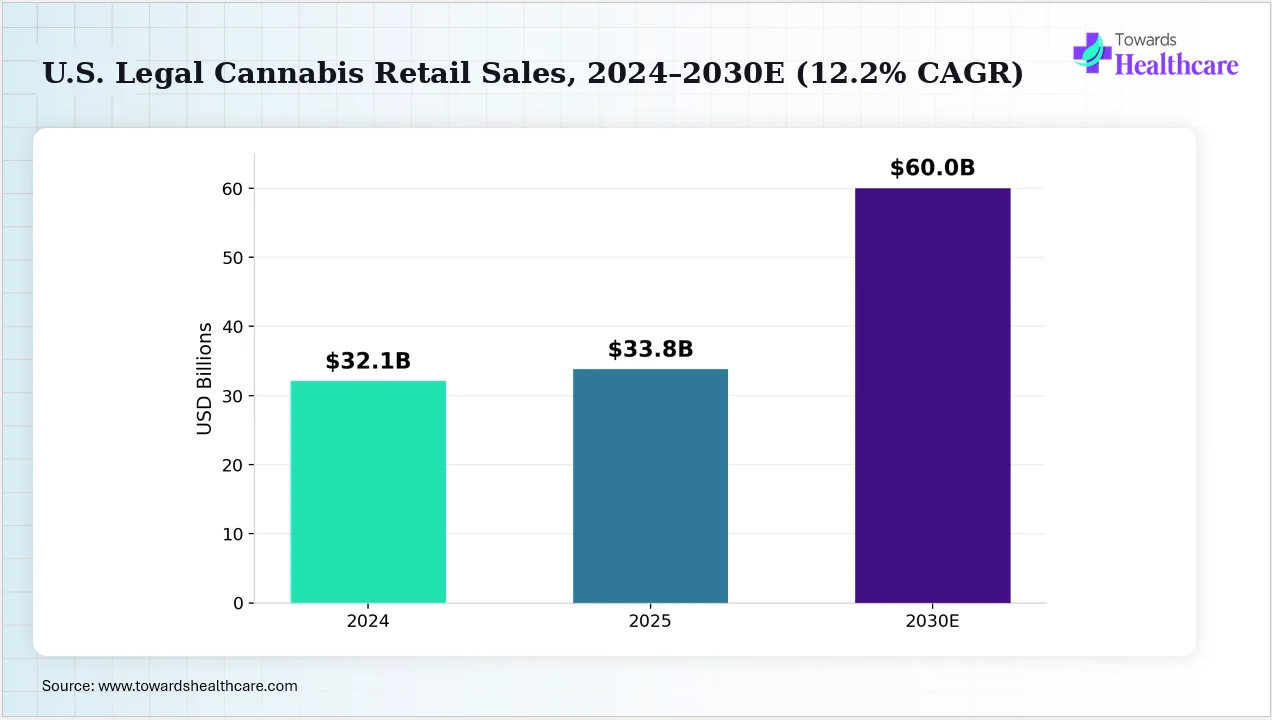
Graph 10: As a market research analyst, I interpret that U.S. legal cannabis sales will grow significantly till 2030, up to $60B. The U.S. legal cannabis retail sales in 2024 were reported to be USD 32.1 billion, which showed approximately 5% growth in 2025 by contributing to USD 33.8 billion. Furthermore, in 2030, the sales are projected to reach USD 60 billion with a CAGR of 12.2% due to growing medical applications and consumer acceptance rates.
Key Insights
Cannabis waste disposal spending promotes production and retail volume, pushing U.S. cannabis sales toward $60B by 2030. The rise in new-state legalization across Pennsylvania, Florida, and Texas will proportionally expand the compliant cannabis waste stream.
Source: MJBiz Factbook 2026/BDSA data
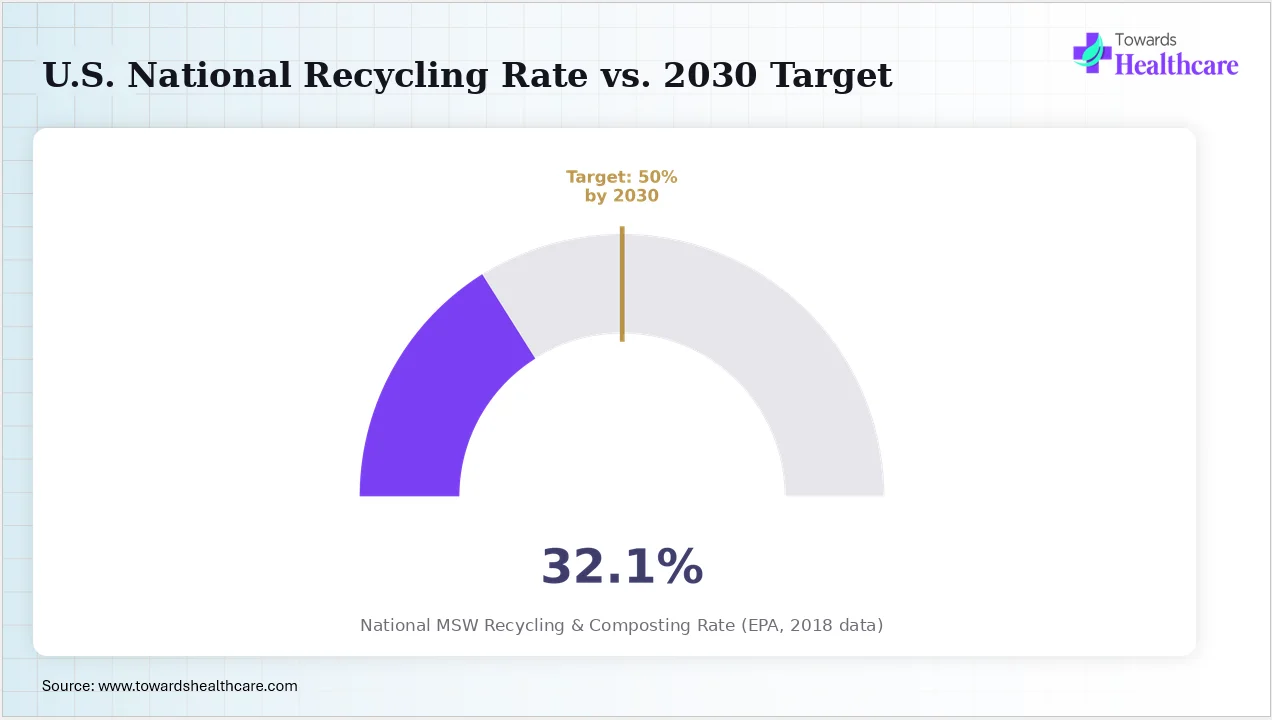
Graph 11: The graph shows that the national MSW recycling & composting rates in 2018 were 32.1%, whereas their target is to achieve 50% by 2030. The U.S. municipal solid waste recycling-and-composting rate was noted to be 32.1% in 2018, which was mentioned in the most recent official EPA dataset. Furthermore, the EPA National Recycling Goal is a 50% recycling-and-composting rate by 2030, as per the announcement in 2020.
Key Insights
The limited structural recycling infrastructure hampers the cannabis packaging and material-recovery programs in the U.S., where they aim to recycle & material recovery of cannabis will be driven by infrastructure investments outpacing the broader U.S. system's pace of improvement.
Source: U.S. EPA, "National Overview: Facts and Figures on Materials, Wastes and Recycling"; U.S. EPA, "U.S. National Recycling Goal" (2020).
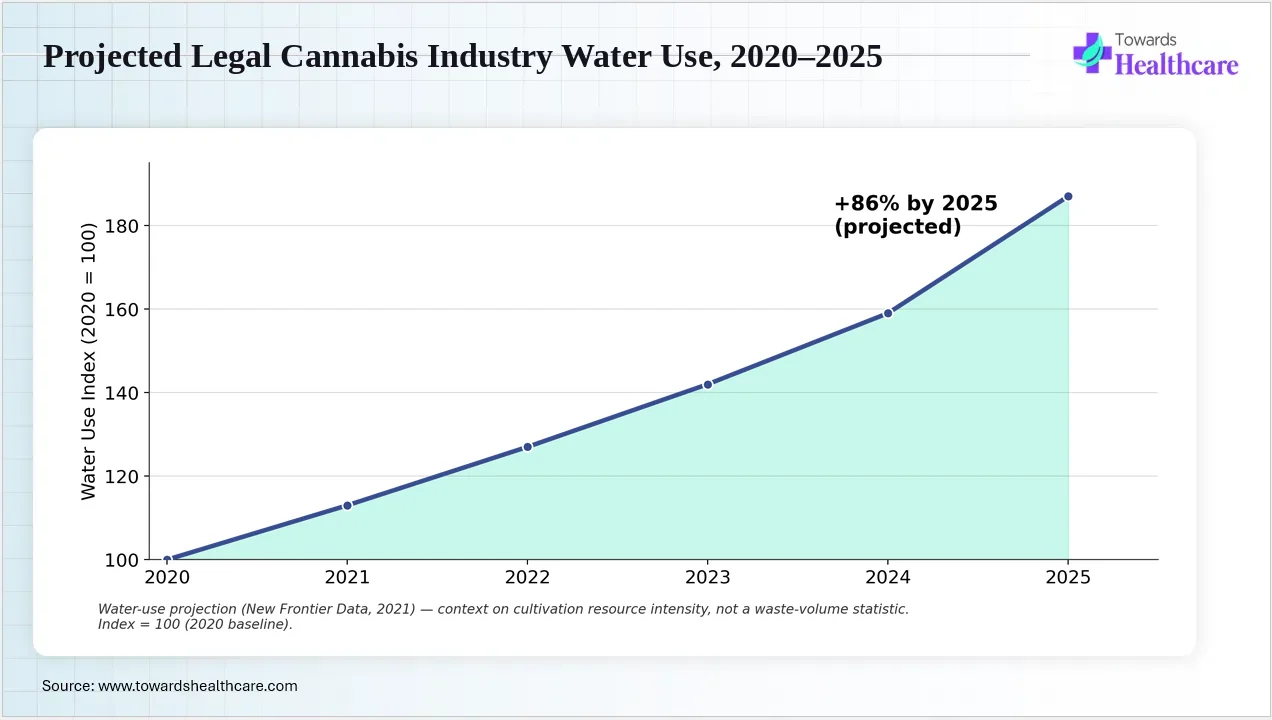
Graph 12: The above-mentioned graph of treatment technology highlights that mechanical shredding held the largest share of 29% and a CAGR of 13.4%, which was followed by thermal treatment with 22% and 13.7% CAGR. As per the data Aman gathered from New Frontier Data, 2021 projection, in partnership with Resource Innovation Institute and the UC Berkeley Cannabis Research Center, the legal cannabis industry water use experienced a rise of 86% from 2020 to 2025, due to growing cultivation rates.
Key insights
It highlights a resource-use projection due to growth in cultivation activities, which increases biomass, wastewater, and packaging output, increasing the demand for integrated waste and resource-recovery infrastructure.
Source: New Frontier Data (2021) and C&EN.
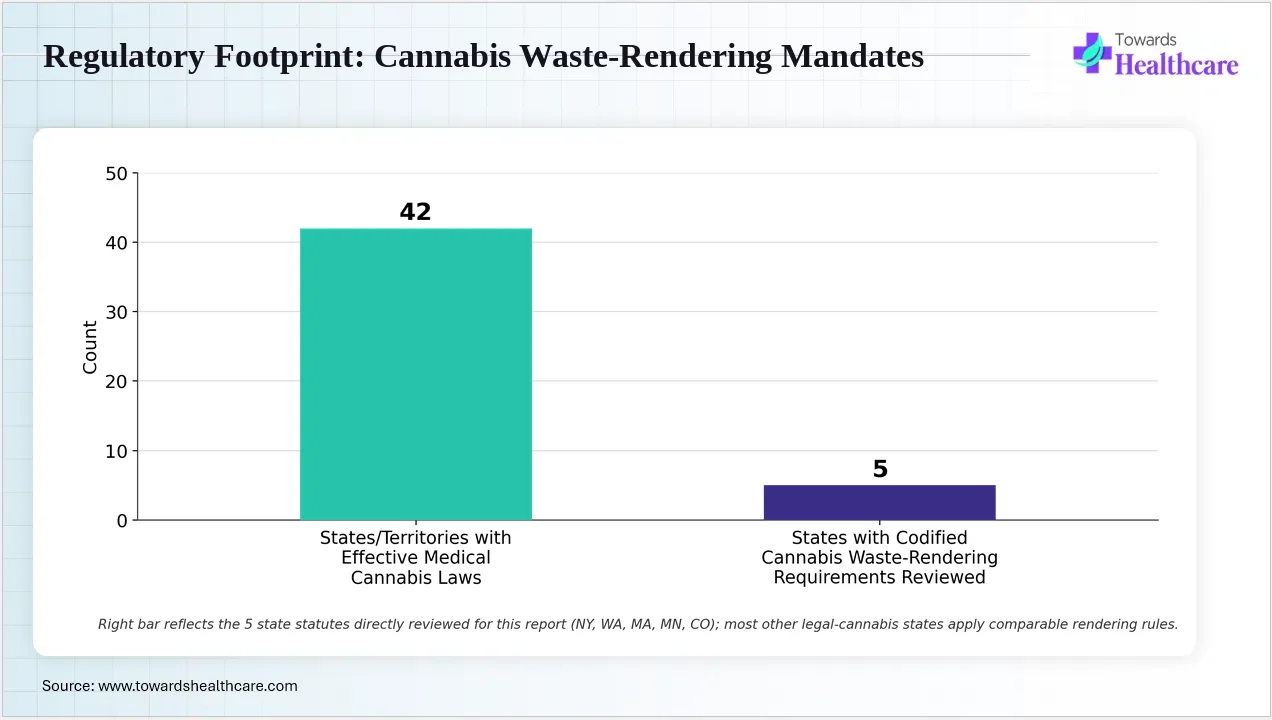
Graph 12: State-level cannabis waste statutes reviewed require converting waste into unusable and unrecognizable material by mixing it with non-cannabis materials before its disposal across New York, Washington, Massachusetts, Minnesota, and Colorado. Various effective medical cannabis laws were introduced as of 2025 across 42 U.S. states, D.C., and several territories.
Key insights
It outlines that compliant destruction is a legal requirement requiring certification and documentation before disposal, which makes cannabis waste services a regulated utility rather than a typical B2B service line.
Source: Towards Healthcare Database
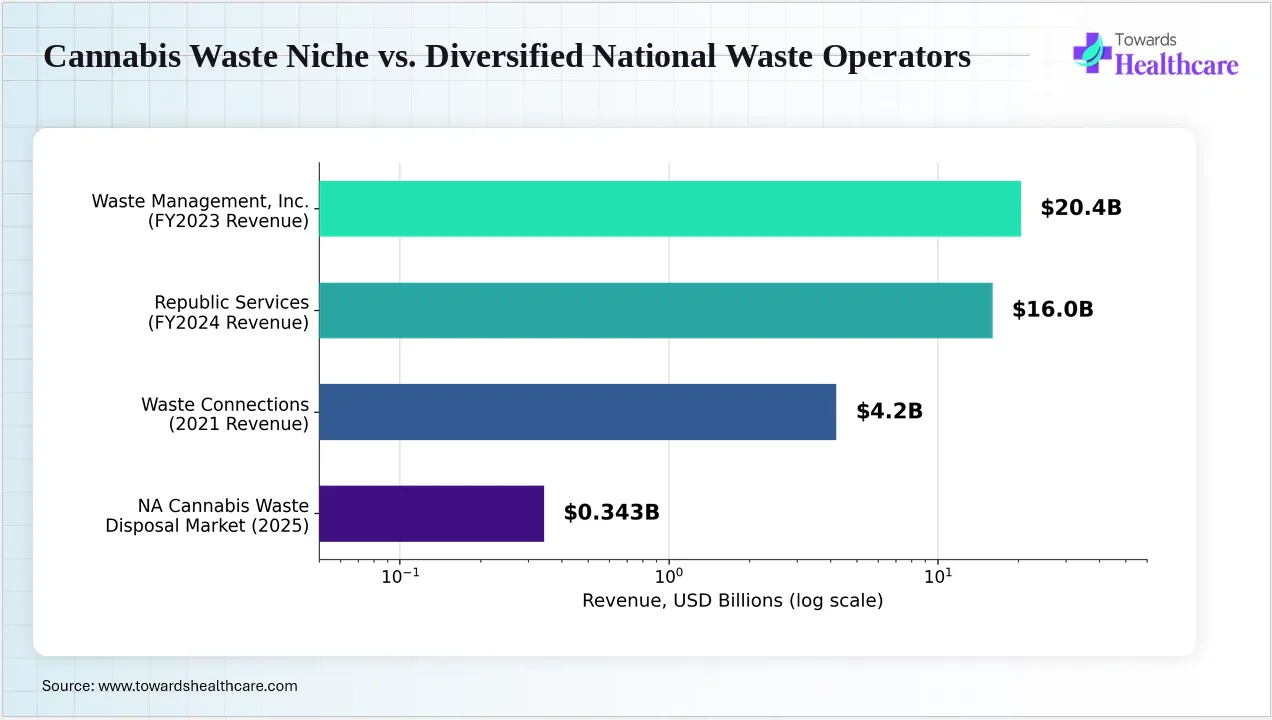
Graph 13: The graph represents, that 2019 showed high venture capital investments, while it dropped to USD 410M in 2024. Waste Connections, Inc. (WCN) reported a growth of USD 4.2 billion in 2021, whereas the FY revenue of Waste Management, Inc. (WM) in 2023 was noted to be USD 20.43 billion. Furthermore, in 2024, Republic Services, Inc. (RSG) had USD 16.03 billion in FY2024 revenue.
Key insights
Cannabis waste disposal is a niche area which position the three major companies as latent entrants or acquirers, making them the major players in the sector.
Source: Public company financial disclosures
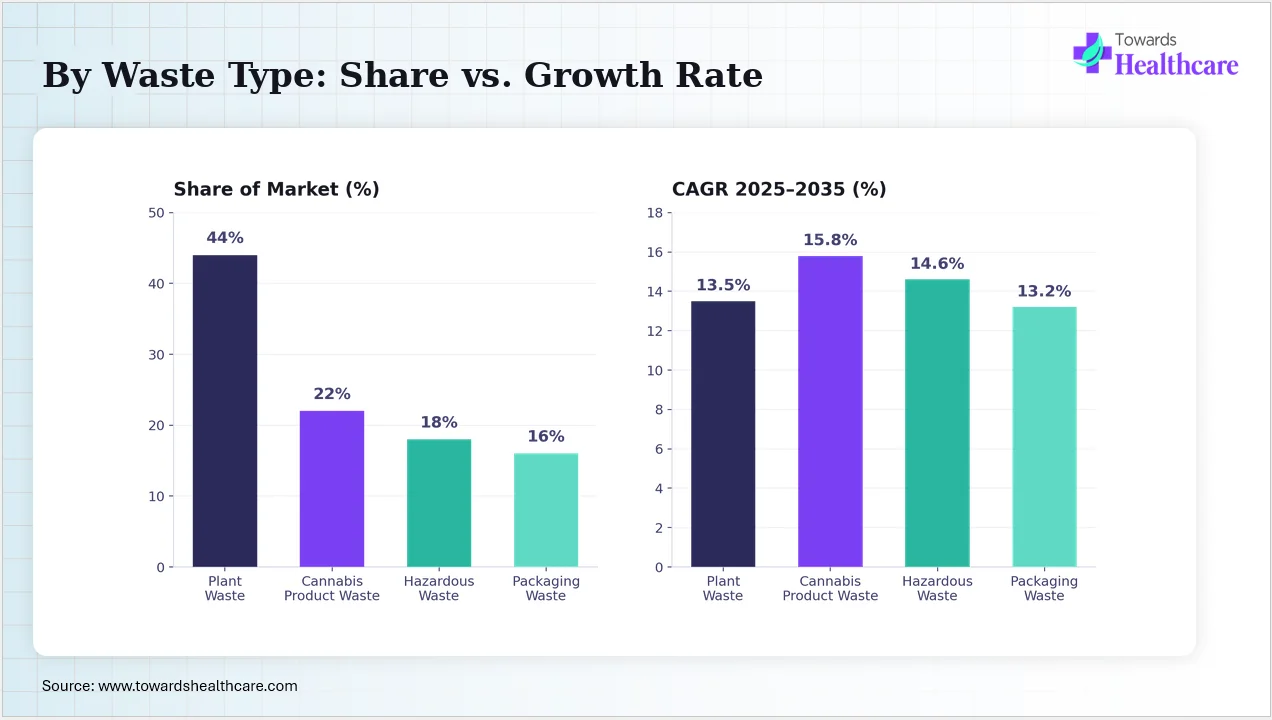
| Segment | Share (%) | CAGR | Growth Driver |
| Plant Waste | 44.00% (Dominating) | 13.5% |
Large cultivation volumes continuously generated biomass. Regulations require destruction before disposal; Expansion of cultivation facilities sustained waste generation. |
| Cannabis Product Waste | 22.00% | 15.8% (Fastest) | Rising product recalls and expired inventory; Higher production of infused products boosts disposal needs; Retail expansion accelerates waste generation. |
| Hazardous Waste | 18.00% | 14.6% | Extraction activities increase solvent disposal. Laboratory operations require compliant hazardous waste handling. Regulatory oversight strengthens their demand. |
| Packaging Waste | 16.00% | 13.2% |
Child-resistant packaging requirements generate significant waste. Sustainability initiatives encourage recycling. Packaging volumes rise with sales |
Table 1: Based on the research findings and my interpretation, the plant waste segment accounted for the highest revenue share of 44.00% of the market in 2025, due to biomass cultivation. The cannabis product waste segment is expected to show the fastest CAGR of 15.8%, where the hazardous waste segment held 18.00% share, and the packaging waste segment held 16.00% share in 2025.
Key insights
Plant waste segment scale keeps it dominating the market, where product waste is fastest growing due to rising product recalls and infused-product output.
Source: Towards Healthcare Database
| Segment | Share (%) | CAGR | Growth Driver |
| Composting | 28.00% (Dominating) | 13.6% |
Organic cannabis biomass was suitable for composting. Environmental regulations encouraged sustainable disposal. Cultivators increasingly adopted composting programs |
| Incineration | 20.00% | 12.4% |
High-security destruction remains widely accepted. Hazardous waste requires thermal destruction. Licensed operators prefer certified facilities |
| Landfill Disposal | 15.00% | 9.8% |
Rendered cannabis waste is disposed of through approved landfills. Compliance remains essential. |
| Recycling & Material Recovery | 15.00% | 16.7% (Fastest) |
Circular economy initiatives expand recycling investments. Packaging recovery gains momentum. Sustainability targets increase adoption. |
| Autoclaving | 12.00% | 13.1% |
Medical and laboratory waste requires sterilization. Compliance standards support adoption. Processing facilities increasingly utilize autoclaves. |
| Chemical Treatment | 10.00% | 12.8% |
Chemical neutralization supports hazardous waste management. Extraction residues require specialized treatment. Environmental safety standards drive demand. |
Table 2: The composting segment led the market with 28.00% due to organic biomass suitability, while the recycling & material recovery segment is expected to expand rapidly with 16.7% CAGR. The incineration segment held 20.00% market share, while landfill disposal accounted for 15.00% share. The autoclaving segment and chemical treatment segment are expected to grow with 13.1% and 12.8% CAGR, respectively.
Key insights:
The composting segment dominated the market, where rising circular-economy investments are accelerating recycling & material recovery segment expansion.
Source: Towards Healthcare Database
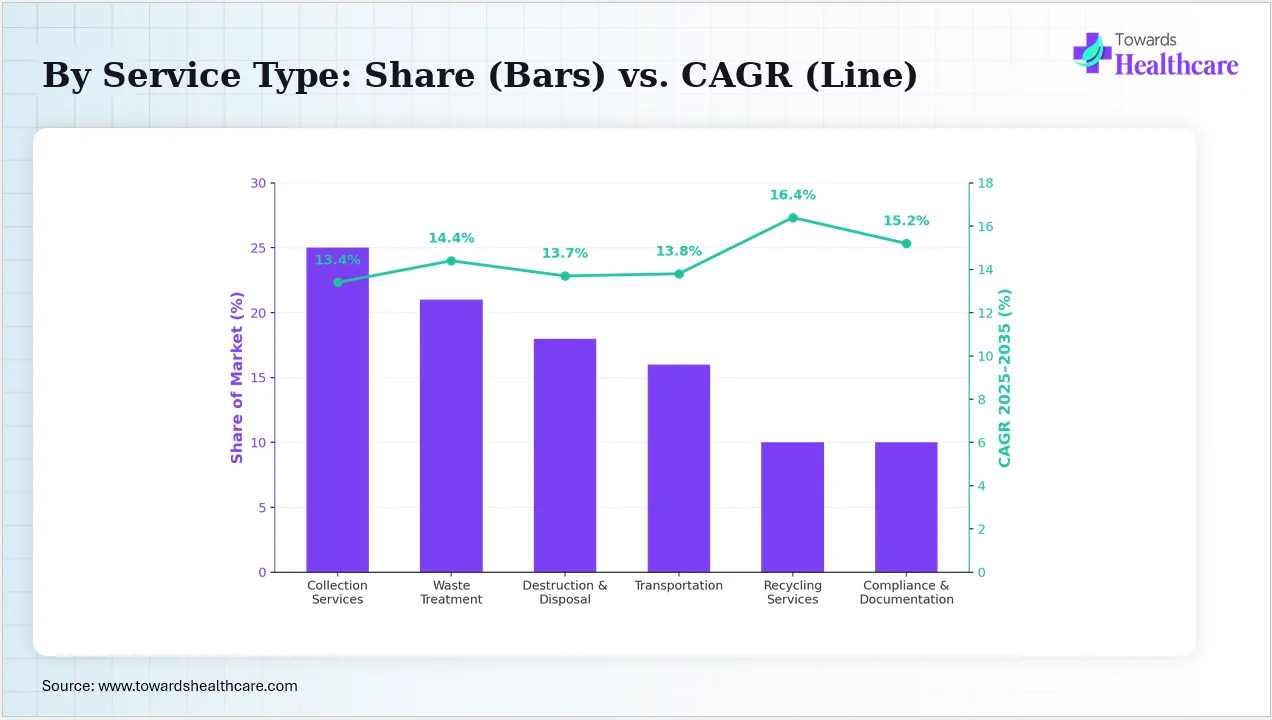
| Segment | Share (%) | CAGR | Growth Driver |
| Collection Services | 25.00% (Dominating) | 13.4% |
Frequent waste pickups are required. Licensed operators relied on scheduled collection. Market expansion increased service demand. |
| Waste Treatment Services | 21.00% | 14.4% |
Processing facilities require compliant treatment.Technology investments improve efficiency. Environmental standards strengthen their demand. |
| Destruction & Disposal Services | 18.00% | 13.7% |
Mandatory destruction regulations sustain demand. Certified documentation increases service value. Industry compliance supports outsourcing. |
| Transportation Services | 16.00% | 13.8% |
Secure transport remains mandatory. GPS-enabled logistics improve compliance. Interstate regulations support specialized providers. |
| Recycling Services | 10.00% | 16.4% (Fastest) |
Sustainability initiatives accelerate recycling adoption. Packaging recovery programs expansion. Corporate ESG goals encourage investment. |
| Compliance & Documentation Services | 10.00% | 15.2% |
Digital tracking simplifies audits. Increasing regulatory reporting requirements.Software integration improves compliance efficiency. |
Table 3: The graph represents the dominance of collection services with the market share of 25.00% in 2025, due to frequent mandatory pickups, while the recycling services segment contributes as the fastest-growing segment with a CAGR of 16.4%. The waste treatment services segment 21.00% share, which was followed by the destruction & disposal services segment at 18.00%. The transportation services segment contributed to 16.00%, and the compliance & documentation services segment held 15.2%.
Key Insights
It highlights that the collection services dominated the market, but the growing ESG-driven recycling programs are fueling the recycling services segment's rapid expansion.
Source: Towards Healthcare Database
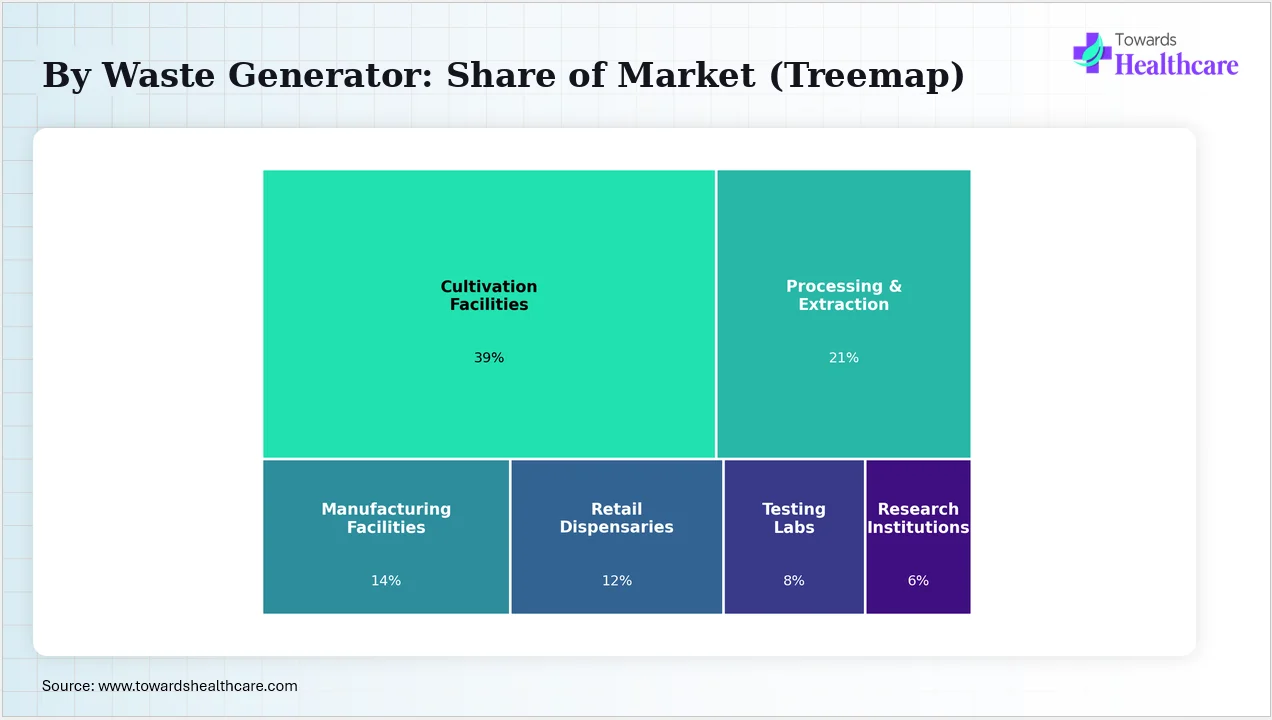
| Segment | Share (%) | CAGR | Growth Driver |
| Cultivation Facilities | 39.00% (Dominating) | 13.8% |
Cultivation produced the largest biomass waste. Harvest cycles generated continuous disposal needs. Licensed growers require regulatory compliance |
| Processing & Extraction Facilities | 21.00% | 15.9% (Fastest) |
Solvent extraction generates hazardous waste. Concentrate production continues expanding. Compliance requirements increase outsourcing. |
| Manufacturing Facilities | 14.00% | 15.1% |
Growth in edibles and beverages increases production waste. Packaging waste also rises. Product diversification supports disposal demand. |
| Retail Dispensaries | 12.00% | 14.2% |
Expired inventory requires secure destruction. Retail expansion increases disposal frequency. Compliance audits encourage outsourcing. |
| Testing Laboratories | 8.00% | 13.3% |
Laboratory chemicals require certified disposal. Sample destruction remains mandatory. Regulatory testing volumes continue rising. |
| Research Institutions | 6.00% | 12.5% |
Research waste requires specialized disposal. Clinical cannabis studies continue increasing. Laboratory compliance supports market growth. |
Table 4: As per the above-mentioned graph & table, the cultivation facilities segment contributed to the maximum share of 39%, as they were the largest biomass source. The processing & extraction facilities segment is the second largest and the fastest-growing segment with 21.00% market share and 15.9% CAGR, while the manufacturing facilities segment is its competitor, which is expanding at 15.1% CAGR. The retail dispensaries segment held a 12.00% share, the testing laboratories segment will grow at 13.3% CAGR, and the research institutions segment held 6.00% market share in 2025.
Key Insights
The cultivation facilities segment held the major revenue share, where the expanding solvent-heavy extraction operations are driving the processing & extraction facilities segment growth.
Source: Towards Healthcare Database
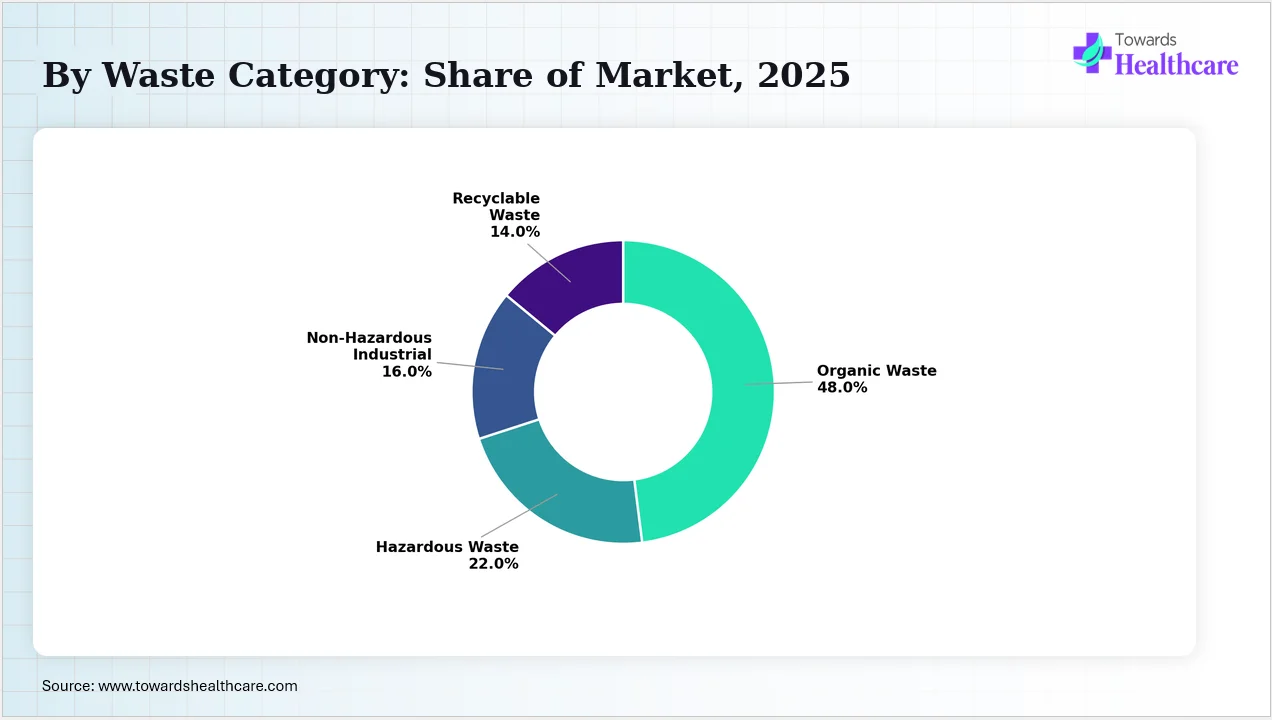
| Segment | Share (%) | CAGR | Growth Driver |
| Organic Waste | 48.00% (Dominating) | 13.5% |
Biomass represented the largest waste stream. Cultivation expansion increased organic waste. Composting adoption supported management. |
| Hazardous Waste | 22.00% | 15.7% (Fastest) |
Extraction chemicals require certified disposal. Laboratory operations expand hazardous waste generation. Regulatory enforcement increases compliance. |
| Non-Hazardous Industrial Waste | 16.00% | 12.9% |
Facility operations generate routine industrial waste. Production expansion raises disposal volumes. Outsourcing improves efficiency. |
| Recyclable Waste | 14.00% | 15.0% |
Sustainable packaging increases recycling opportunities. ESG initiatives encourage recovery. Recycling infrastructure continues expanding. |
Table 5: As per my analysis, the table and graphs highlight waste categories, where the organic waste segment held the dominant share of the market with 48% in 2025, due to growth in biomass. The hazardous waste segment is rapidly expanding with a CAGR of 15.7%, which is followed by the hazardous industrial waste segment with a 16.00% market share. The recyclable waste segment held a 14.00% share of the market in 2025.
Key Insights:
The organic waste segment dominated the market due to growth in biomass volume, whereas expanding extraction and lab operations are accelerating the growth of the hazardous waste segment.
Source: Towards Healthcare Database
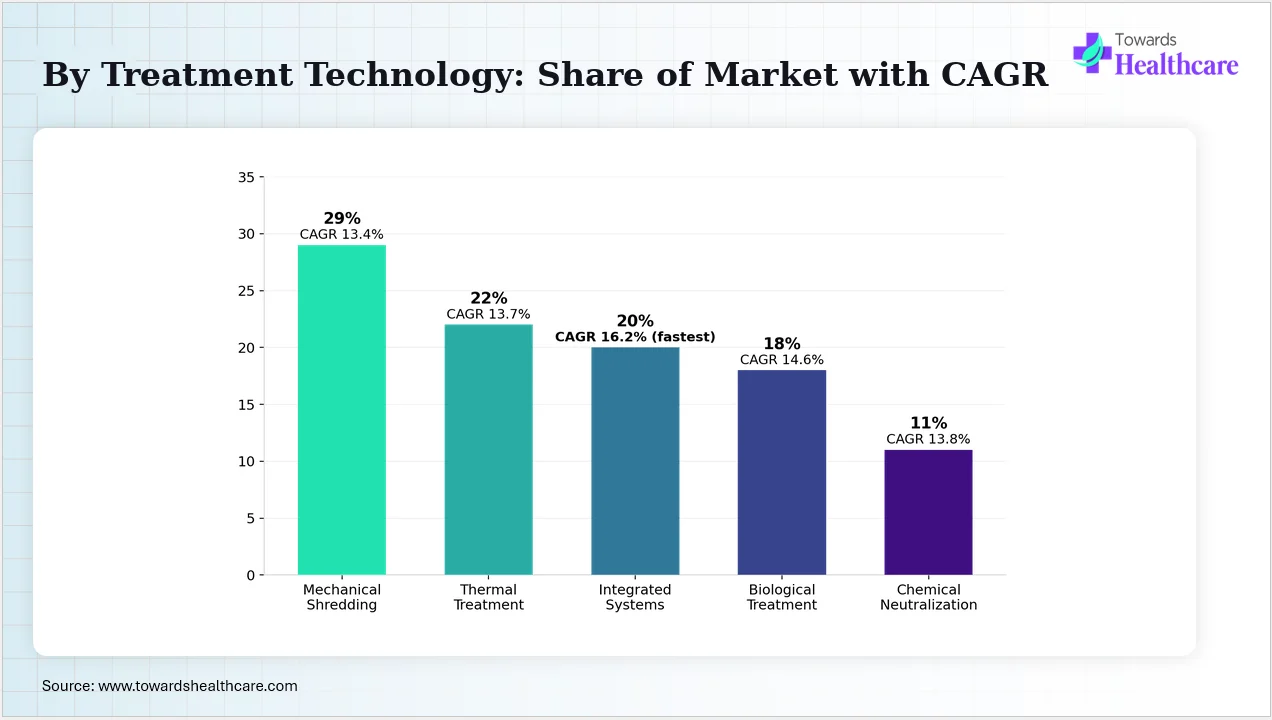
| Segment | Share (%) | CAGR | Growth Driver |
| Mechanical Shredding | 29.00% (Dominating) | 13.4% | Regulations require cannabis waste rendering. Shredding is cost-effective. Most facilities integrated shredding systems |
| Thermal Treatment | 22.00% | 13.7% |
Hazardous waste requires high-temperature destruction. Extraction facilities increase demand. Certified operators expand capacity. |
| Integrated Waste Treatment Systems | 20.00% | 16.2% (Fastest) |
Automated systems improve compliance. Facilities seek operational efficiency. Integrated solutions reduce disposal costs. |
| Biological Treatment | 18.00% | 14.6% |
Composting technologies gaining popularity. Sustainability initiatives promote biological solutions. Organic waste supports adoption. |
| Chemical Neutralization | 11.00% | 13.8% |
Chemical residues require neutralization. Laboratory compliance drives utilization. Hazardous waste regulations remain stringent. |
Table 6: By compiling the above-mentioned, it is represented that the mechanical shredding segment contributed 29.00% of the market and held a dominant position, due to its affordable procedures. The thermal treatment segment held the second-largest position with a 22.00% share, where the integrated waste treatment systems segment is expected to show the highest growth with 16.2% CAGR. The biological treatment segment held an 18.00% share, while the chemical neutralization segment held 11.00% in 2025.
Key Insights:
The mechanical shredding segment led the market due to its cost-effective shredding, but automated, integrated treatment platforms are expected to expand rapidly, promoting the integrated waste treatment systems segment's highest growth.
Source: Towards Healthcare Database
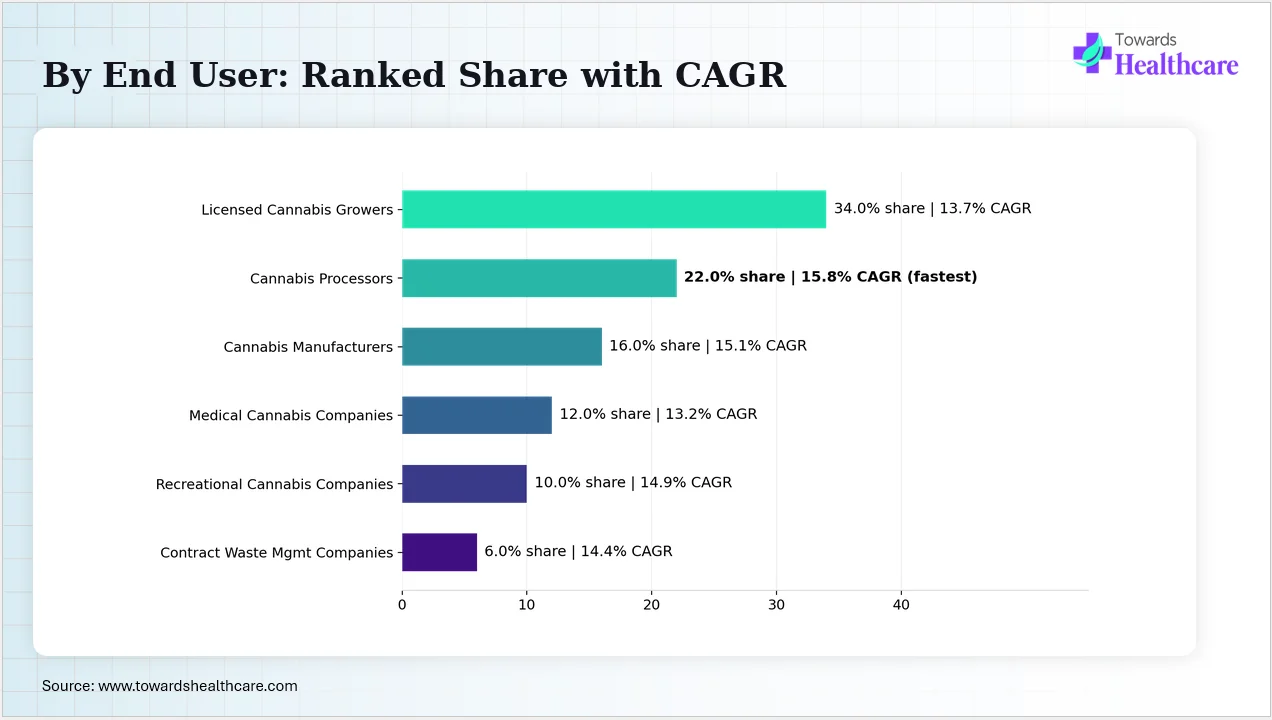
| Segment | Share (%) | CAGR | Growth Driver |
| Licensed Cannabis Growers | 34.00% (Dominating) | 13.7% |
Large cultivation acreage produced continuous waste. Compliance regulations increased professional disposal. Commercial cultivation expanded steadily. |
| Cannabis Processors | 22.00% | 15.8% (Fastest) |
Concentrate production increases hazardous waste. Advanced extraction technologies generate more residues. Compliance outsourcing continues rising |
| Cannabis Manufacturers | 16.00% | 15.1% |
Product diversification expands manufacturing waste. Packaging disposal grows. Food-grade compliance supports specialized services. |
| Medical Cannabis Companies | 12.00% | 13.2% |
Medical production requires strict documentation. Product quality regulations increase certified disposal. Market expansion supports their growth. |
| Recreational Cannabis Companies | 10.00% | 14.9% |
Retail legalization increases product turnover. Expired inventory requires compliant destruction. Consumer demand accelerates waste generation. |
| Contract Waste Management Companies | 6.00% | 14.4% |
Specialized contractors expand regional operations. Outsourcing improves regulatory compliance. Industry consolidation supports service growth. |
Table 7: As a market analyst, I interpret based on the data gathered that licensed cannabis growers are the dominant shareholders in the market with 34.00% in 2025, due to large cultivation practices. The cannabis processors segment is the second largest and the fastest-growing segment with 15.8% CAGR, whereas the cannabis manufacturers segment held 16.00%. The medical cannabis companies segment contributed to 12.00%, followed by the recreational cannabis companies segment, which held 10.00%. The contract waste management companies segment held 6.00% market share in 2025.
Key insights
The licensed cannabis growers segment dominated the market due to growth in cultivation parcels, but the growing demand for extraction and concentrate production is driving the growth of the cannabis processors segment at the fastest rate.
Source: Towards Healthcare Database
| Date | Development | Source |
| June 5, 2025 | Vireo Growth Inc. closed its acquisition of Proper Brands in Missouri, expanding its multi-facility cultivation and processing footprint. | New Cannabis Ventures, "Mergers and Acquisitions" news feed. |
| March 21, 2025 | LCD biodigester, which is a groundbreaking solution for the disposal of cannabis waste, was introduced by Power Knot LLC | PRNewswire |
| April 12, 2025 | Washington State's amended cannabis waste rule (WAC 314-55-097) took effect, refining requirements for rendering and disposing of solid and liquid cannabis waste, including sellable, low-THC waste streams. | Washington Administrative Code §314-55-097; filed 3/12/25, effective 4/12/25 (Wash. State Legislature / Cornell LII). |
| 2025 | Minnesota's cannabis environmental standards and disposal rule (Minn. R. 9810.1200) took formal effect, requiring licensed cannabis businesses to classify and dispose of all waste, including cannabis-specific waste, in compliance with state solid- and hazardous-waste chapters. | Minnesota Office of the Revisor of Statutes, Rule 9810.1200 (Environmental Standards and Disposal). |
| 2025 | FLUENT completed its acquisition of RIV Capital, adding New York cultivation, wholesale, and retail operations to its multi-state footprint. | New Cannabis Ventures, "Mergers and Acquisitions" news feed. |
| November 2024 | Canopy USA completed its acquisition of Acreage Holdings for approximately USD 258 million, consolidating cultivation and processing assets and their associated waste streams under a single ownership structure. | Valuation Research Corporation, "Cannabis Industry Update – February 2025." |
| November 5, 2024 | Agrify Corporation, a cultivation and extraction technology provider, secured a USD 20 million convertible secured note facility from a wholly owned subsidiary of Green Thumb Industries. | Valuation Research Corporation, "Cannabis Industry Update – February 2025." |
| 2021 (ongoing reference framework) | Colorado updated its cannabis waste regulations to exempt low-THC plant material (stems, root balls) from the 50:50 non-cannabis mixing requirement and to permit dispensary-level packaging recycling collection a model since referenced by other states' rulemaking. | American Chemical Society, C&EN, "Cannabis industry inches toward sustainability." |
It offers services such as solid waste collection, hazardous waste management, transfer, disposal, and recycling, where it serves industrial and specialty waste streams including regulated hazardous materials relevant to cannabis extraction waste services. They reported revenue of USD 20.43 billion in FY2023, with operating income of USD 3.575 billion, making it the largest waste management company in North America by revenue.
The company provides non-hazardous solid waste collection, transfer, disposal, recycling, and energy services across the U.S. Its FY2024 revenue was announced to be USD 16.03 billion, with operating income of USD 3.196 billion, and it consists of approximately 42,000 employees, making it the second-largest U.S. waste disposal provider by revenue.
Integrated solid waste collection, transfer, disposal, and recycling services are provided by the company across the U.S. and Canada. The company reported USD 4.2 billion and approximately 19,998 employees in 2021, which contributed in maintaining its position as the third-largest waste management company in North America.
It is a private hazardous-waste management and environmental services provider serving life sciences, healthcare, education, and industrial clients across the U.S. and Canada, including cannabis waste disposal, on-site waste rendering plans, and DEA-compliant destruction services. The company was founded in 1988 in Boston and consists of approximately 1,600 employees.
It offers cannabis-specific waste disposal services where it specializes in on-site waste rendering, compliance documentation, and renewable cannabis energy solutions for California cultivators, processors, and dispensaries. The company also focuses on waste treatment, environmental services & recycling.
It is a full-service hazardous waste management company offering cannabis-specific waste management plans, DOT-approved container programs, waste stream characterization, and wastewater collection/treatment/disposal for licensed cannabis operators.
The company supports Nationwide hemp and cannabis waste disposal and lab-pack disposal services, alongside broader industrial, commercial, and healthcare hazardous waste handling.
Aditi is a life science research expert with strong experience in pharmaceuticals, cannabis processing, and recreational applications markets. She conducted detailed market research, analyzed company data, clinical trends, and industry developments. Based on her comprehensive analysis, the following strategic key takeaways highlight the most important market insights and opportunities.
Based on my assessment, the market is expanding rapidly due to growing legalization trends. The growth in cannabis medical products manufacturing will drive the demand for their proper waste disposal services. I also anticipate that the new collaboration among the major companies can enhance access to their services. I also see strong growth in cannabis cultivation and treatment technologies, which will create new market opportunities.
Payal Rabde led the primary market research, developed the methodology, analyzed trends, segmentation, competition, forecasts, and strategic opportunities, forming the report's analytical foundation.
Aman was responsible for collecting and validating clinical trial data, research publications, company information, partnerships, and other quantitative datasets, strengthening evidence-based analysis and market estimations.
Aditi reviewed the complete research document, performed quality checks, validated findings, refined content, corrected inconsistencies, and finalized the report, ensuring accuracy, clarity, credibility, and publication-ready quality.
By Waste Type
By Disposal Method
By Service Type
By Waste Generator
By Waste Category
By Treatment Technology
By End User
By Region






















Principal Consultant
Payal Rabde is a Healthcare Market Research Analyst at Towards Healthcare Research & Consulting with 4+ years of experience in pharmaceuticals, biotechnology, medical devices, and life sciences.
Learn more about Payal Rabde

Reviewed By
Aditi Shivarkar is a seasoned professional with over 14 years of experience in healthcare market research. As a content reviewer, Aditi ensures the quality and accuracy of all market insights and data presented by the research team.
Learn more about Aditi Shivarkar