
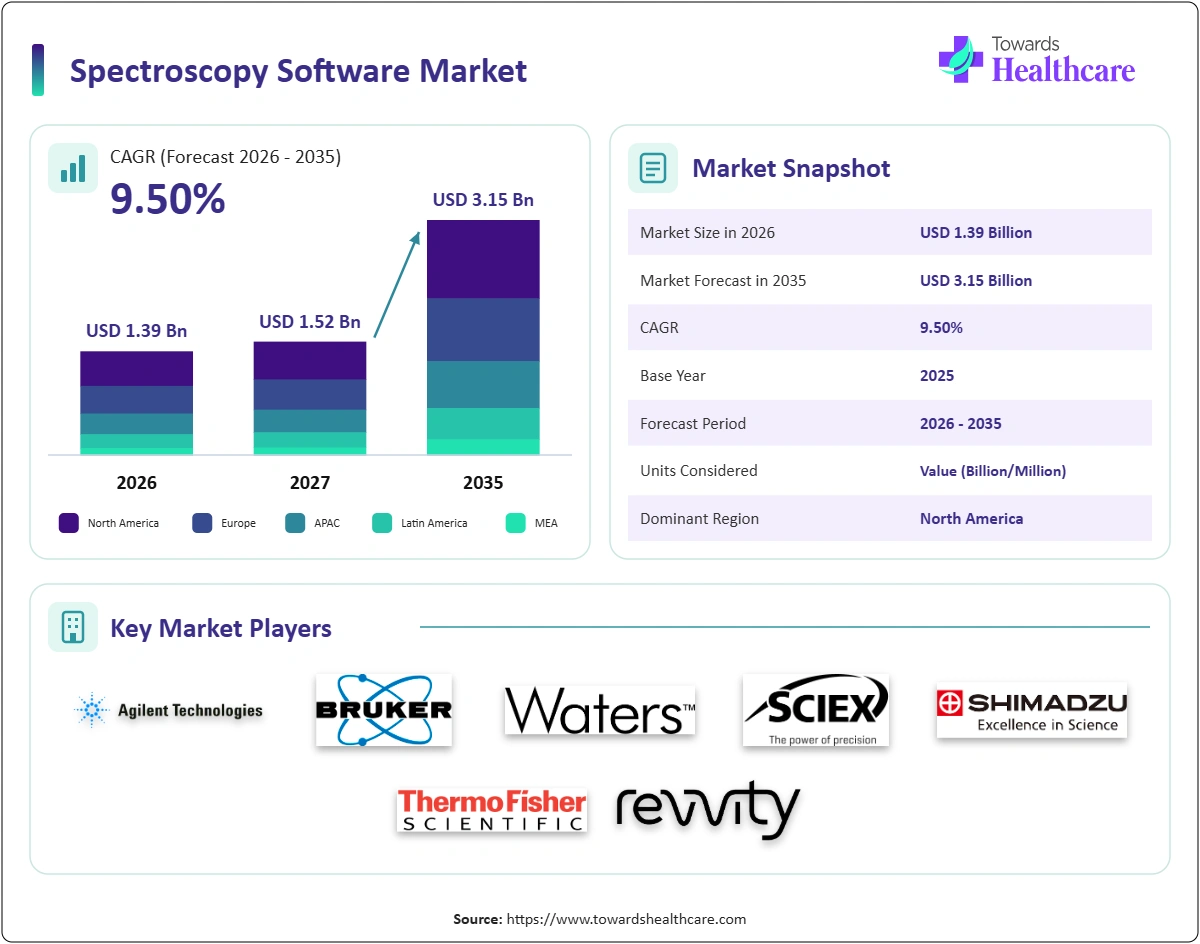
The forecast for the global spectroscopy software market is expected to increase from USD 1.27 billion in 2025 to USD 3.15 billion by 2035 due to rapid increases in spectral data output in laboratories and the requirement of validated software for instrument control and result interpretation. The factors responsible for high growth include cloud services and subscriptions, AI-based chemometrics, process analytical technology in manufacturing, and the rise in Raman and portable spectrometers and testing in the food and environmental sector, which will take the market value to USD 2.00 billion by 2030 with a CAGR of 9.50%.
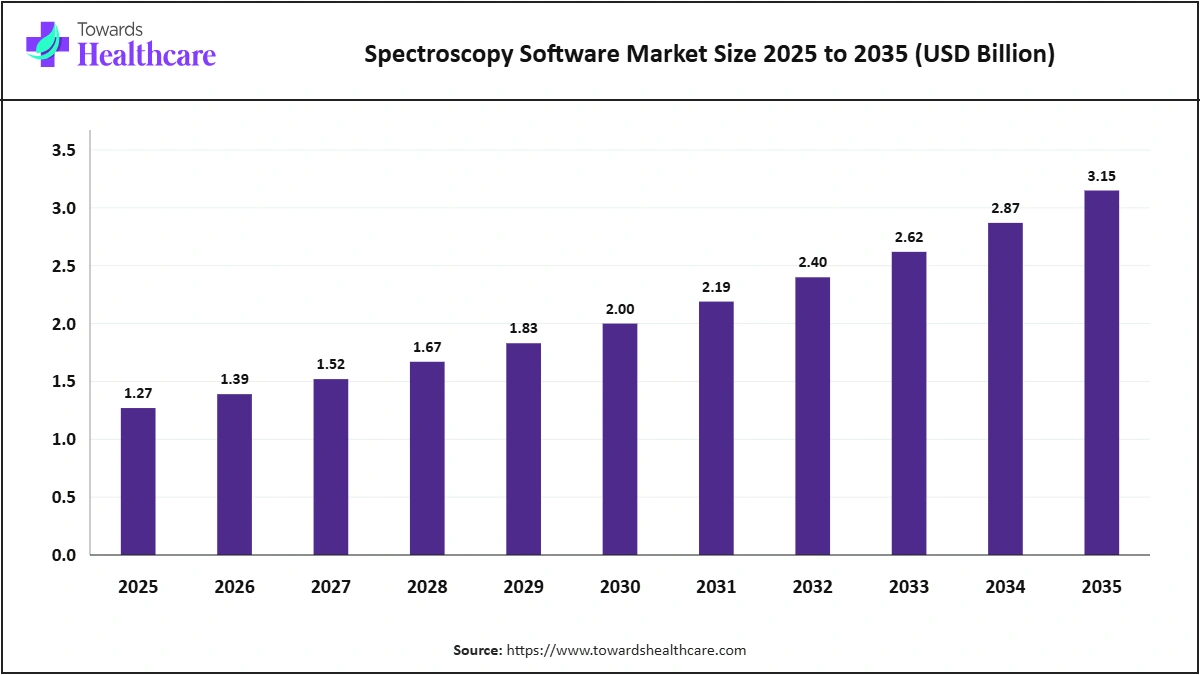
Analyst View: The projection was constructed based on the installed base of spectroscopy equipment by technology type, the percentage that uses paid software, licence, subscription and maintenance fees, and sales of stand-alone chemometrics, library and data management software. Equipment installations represent the laboratory activity related to pharmaceuticals, chemicals, food, environment and academia, while software purchases relate to upgrade cycle, compliance requirements, and the shift towards subscriptions. The aggregate figure has been checked against the software and informatics sales of leading companies in the instrument and software space, as well as against available estimates, placing our base year slightly above the highest credible comparable number. The growth rate is based on increasing cloud and AI adoption, which we consider justifies a slightly higher rate compared to comparable estimates.
Driver: Spectral data volumes grow. Data integrity rules tighten. PAT spreads in manufacturing. AI improves interpretation. Food and environmental testing expand.
Restraint: Licences and validation are costly. Chemometrics skills are scarce. Data sovereignty limits cloud use. Proprietary formats lock users in. Budget pressure affects academia.
Opportunity: Cloud subscriptions widen access. Asian labs adopt modern software. Handheld instruments need analytics. Open APIs enable new tools. AI models create premium features.
| Segments | 2025 Share | 2025 Value (USD Billion) | 2035 Value (USD Billion) | CAGR 2026–2035 |
| On-Premise | 55.00% | 0.70 | 1.49 | 7.85% |
| Cloud-Based | 45.00% | 0.57 | 1.66 | 11.25% |
Note: 2025 is the base year; 2035 values are forecasts.
Sources: Expert interviews, secondary sources, Towards Healthcare database, and Towards Healthcare analysts.
On-Premise: This segment represented 55.00% (USD 0.70 billion) of the total spectroscopy software market in 2025 and is estimated to reach USD 1.49 billion by 2035, witnessing a CAGR of 7.85% from 2026 to 2035. On-premise software refers to the installation of software either on the local computer or server that is connected to the instrument. The segment dominates due to the fact that validated systems are preferred by regulated laboratories, such as pharmaceutical and industrial laboratories, under data integrity regulations, including FDA 21 CFR Part 11.
| Segments | 2025 Share | 2025 Value (USD Billion) | 2035 Value (USD Billion) | CAGR 2026–2035 |
| Infrared | 27.20% | 0.35 | 0.81 | 8.80% |
| Mass Spectrometry | 24.60% | 0.31 | 0.75 | 9.20% |
| Raman | 14.80% | 0.19 | 0.57 | 11.70% |
| NMR | 12.40% | 0.16 | 0.38 | 9.20% |
| UV-Vis | 11.20% | 0.14 | 0.34 | 9.20% |
| Others | 9.80% | 0.12 | 0.30 | 9.20% |
Note: 2025 is the base year; 2035 values are forecasts.
Sources: Expert interviews, secondary sources, Towards Healthcare database, and Towards Healthcare analysts.
Infrared: This segment held a share of 27.20% (USD 0.35 billion) in the global spectroscopy software market in 2025 and is expected to account for USD 0.81 billion by 2035, growing at a CAGR of 8.80% during 2026-2035. Infrared software, comprising FTIR and near-infrared spectroscopy, including OMNIC from Thermo Fisher and OPUS from Bruker, is the leading technique-based segment because FTIR and NIR devices find widespread applications in the analysis of pharmaceuticals, polymers, food, and materials.
Mass Spectrometry: This segment held a share of 24.60% (USD 0.31 billion) in the global spectroscopy software market in 2025 and is expected to account for USD 0.75 billion by 2035, growing at a CAGR of 9.20% during 2026-2035. Mass spectrometry software controls instruments and processes complex spectra for the purpose of identification and quantification in proteomics, metabolomics, pharmaceuticals, and environmental studies and is available from Thermo Fisher, Waters, SCIEX, Agilent, Bruker, and Shimadzu.
Raman: This segment comprised 14.80% (USD 0.19 billion) of the spectroscopy software market in 2025 and is expected to reach USD 0.57 billion by 2035, registering a CAGR of 11.70% between 2026 and 2035. Raman software handles spectra of benchtop, handheld, and process Raman systems. This segment is expected to grow at the fastest rate due to increasing adoption of Raman in pharmaceutical raw material identification, process monitoring, and biopharmaceutical analysis, which usually needs chemometric models.
NMR: This segment comprised 12.40% (USD 0.16 billion) of the spectroscopy software market in 2025 and is expected to reach USD 0.38 billion by 2035, registering a CAGR of 9.20% between 2026 and 2035. NMR software, including TopSpin and other third-party NMR software, processes and analyzes NMR data for structure elucidation and quantitation with rising adoption of benchtop NMR.
UV-Vis: This category constituted 11.20% (USD 0.14 billion) of the spectroscopy software market in 2025 and is expected to grow to USD 0.34 billion by 2035 with a CAGR of 9.20% during 2026 and 2035. UV-Vis software manages spectrophotometers and is used for concentration determination, kinetics, and quality control laboratory compliance.
Others: This category constituted 9.80% (USD 0.12 billion) of the spectroscopy software market in 2025 and is expected to grow to USD 0.30 billion by 2035 with a CAGR of 9.20% during 2026 and 2035. The Other category includes atomic absorption, ICP, X-ray fluorescence, and laser-induced breakdown spectroscopy software.
| Segments | 2025 Share | 2025 Value (USD Billion) | 2035 Value (USD Billion) | CAGR 2026–2035 |
| Data Analysis & Chemometrics | 37.60% | 0.48 | 1.14 | 8.96% |
| Instrument Control & Acquisition | 26.80% | 0.34 | 0.83 | 9.36% |
| Compliance & Data Management | 18.40% | 0.23 | 0.65 | 10.86% |
| Spectral Libraries & Identification | 17.20% | 0.22 | 0.53 | 9.36% |
Note: 2025 is the base year; 2035 values are forecasts.
Sources: Expert interviews, secondary sources, Towards Healthcare database, and Towards Healthcare analysts.
Data Analysis & Chemometrics: This category represented 37.60% (USD 0.48 billion) of the spectroscopy software market in 2025 and is expected to grow up to USD 1.14 billion by 2035, with a CAGR of 8.96% between 2026 and 2035. Data analysis and chemometrics software, including SIMCA by Sartorius, Unscrambler, and PLS-Toolbox by CAMO and Eigenvector, is used to build multivariate models predicting properties, classifying samples, and monitoring processes. This is the largest functional category due to its ability to transform spectra into quantitative information and provide process analytical technology.
Instrument Control & Acquisition: This category represented 26.80% (USD 0.34 billion) of the spectroscopy software market in 2025 and is expected to grow up to USD 0.83 billion by 2035, with a CAGR of 9.36% between 2026 and 2035. Instrument control and acquisition software controls the operation of spectrometers and the acquisition of data, and typically comes along with an instrument as developed by its manufacturer.
Compliance & Data Management: This segment held 18.40% (USD 0.23 billion) of the spectroscopy software market share in 2025 and is expected to grow to USD 0.65 billion by 2035, growing at a CAGR of 10.86% during 2026-2035. Data integrity and compliance software offers audit trails, electronic signatures, and user control. It is the most rapidly growing functional segment, owing to the regulators' focus on data integrity and lab data centralization.
Spectral Libraries & Identification: This segment represented 17.20% (USD 0.22 billion) of the spectroscopy software market share in 2025 and is expected to reach USD 0.53 billion by 2035, growing at a CAGR of 9.36% during 2026-2035. The spectral libraries and identification tools like the Wiley KnowItAll and Wiley Registry/NIST mass spectral library compare the unknown spectra with reference libraries to identify the compounds.
| Segments | 2025 Share | 2025 Value (USD Billion) | 2035 Value (USD Billion) | CAGR 2026–2035 |
| Pharmaceutical & Biotechnology | 39.20% | 0.50 | 1.17 | 8.85% |
| Chemicals & Materials | 18.40% | 0.23 | 0.57 | 9.25% |
| Food & Beverage | 14.60% | 0.19 | 0.56 | 11.75% |
| Academic & Research | 11.80% | 0.15 | 0.36 | 9.25% |
| Environmental Testing | 10.20% | 0.13 | 0.31 | 9.25% |
| Others | 5.80% | 0.07 | 0.18 | 9.25% |
Note: 2025 is the base year; 2035 values are forecasts.
Sources: Expert interviews, secondary sources, Towards Healthcare database, and Towards Healthcare analysts.
Pharmaceutical & Biotechnology: The segment contributed 39.20% (USD 0.50 billion) of the total spectroscopy software market size in 2025 and is expected to reach USD 1.17 billion by 2035, growing at a CAGR of 8.85% during the forecast period. The pharmaceutical and biotechnology application segment holds the largest share in the market, including applications in raw material identification, formulation, process analytical technology, biologics characterization, and quality control that require validated software.
Chemicals & Materials: This segment contributed 18.40% (USD 0.23 billion) of the total spectroscopy software market size in 2025 and is expected to reach USD 0.57 billion by 2035, growing at a CAGR of 9.25% during the forecast period. The chemicals and materials segment makes use of spectroscopy software for polymer analysis, quality control, and materials research.
Food & Beverage: The segment contributed 14.60% (USD 0.19 billion) towards the spectroscopy software market revenue in 2025 and is expected to reach USD 0.56 billion by 2035, growing at a CAGR of 11.75% during 2026-2035. Food and beverage testing is the fastest-growing application as manufacturers employ NIR and Raman techniques along with chemometrics for testing purposes.
Academic & Research: The segment contributed 11.80% (USD 0.15 billion) towards the spectroscopy software market revenue in 2025 and is expected to reach USD 0.36 billion by 2035, growing at a CAGR of 9.25% during 2026-2035. The application of spectroscopy software in academic and research labs is for elucidating chemical structures and method development, along with educational purposes.
Environmental Testing: This segment captured 10.20% (USD 0.13 billion) of the global spectroscopy software market in 2025 and is expected to reach USD 0.31 billion by 2035, growing at a CAGR of 9.25% between 2026 and 2035. The environmental testing labs make use of mass spectrometry and atomic spectroscopy software to test pollutants, PFAS, and metals.
Others: This segment captured 5.80% (USD 0.07 billion) of the global spectroscopy software market in 2025 and is expected to reach USD 0.18 billion by 2035, growing at a CAGR of 9.25% between 2026 and 2035. Forensics, mining, petrochemicals, and semiconductors are other application areas.
Analyst View: Values in each segment were calculated based on the number of instruments deployed, software spend and costs allocated to the deployment type, technique, function and application area based on vendor portfolio and lab information. On-premise, infrared, chemometrics, and pharmaceuticals are leading segments. We believe that cloud, Raman, compliance software, and food testing will take up share.
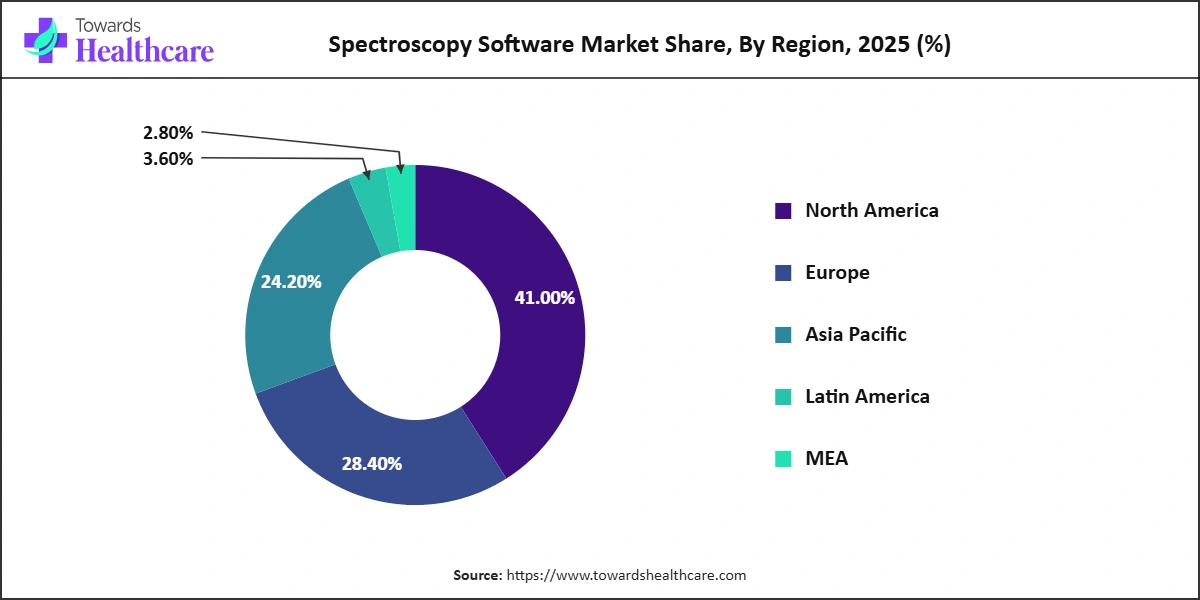
| Region | 2025 Share | 2025 Value (USD Billion) | 2035 Value (USD Billion) | CAGR 2026–2035 |
| North America | 41.00% | 0.52 | 1.21 | 8.74% |
| Europe | 28.40% | 0.36 | 0.86 | 9.14% |
| Asia Pacific | 24.20% | 0.31 | 0.88 | 11.14% |
| Latin America | 3.60% | 0.05 | 0.11 | 9.14% |
| Middle East & Africa | 2.80% | 0.04 | 0.09 | 9.14% |
Note: 2025 is the base year; 2035 values are forecasts.
Sources: Expert interviews, secondary sources, Towards Healthcare database, and Towards Healthcare analysts.
North America: North America held a 41.00% share (USD 0.52 billion) of the total spectroscopy software market value in 2025 and is expected to grow to USD 1.21 billion by 2035 at a CAGR of 8.74% during 2026-2035. The US is home to the largest pharmaceutical, biotechnology, and chemical research and development base, with tough FDA regulation on data integrity and early use of cloud and AI analytics.
Europe: The market share in this region was 28.40% (USD 0.36 billion) in 2025 and is expected to grow to USD 0.86 billion by 2035 at a CAGR of 9.14% between 2026 and 2035. The presence of established pharmaceutical, chemical, and food industries, along with the presence of firms like Bruker, Sartorius, Metrohm, and Anton Paar, makes Europe one of the important regions. EU laws related to data protection are also important factors for the adoption of cloud computing.
Asia Pacific: The market share of this region was 24.20% (USD 0.31 billion) in 2025 and is expected to grow to USD 0.88 billion by 2035 at a CAGR of 11.14% between 2026 and 2035. The fastest-growing region is Asia Pacific, which is due to expanding manufacturing of pharmaceuticals in countries such as China and India, a large chemical industry, electronics industry, and food safety testing industry, along with Japanese instrument manufacturers like Shimadzu and JEOL.
Latin America: This region represented a 3.60% (USD 0.05 billion) share in the spectroscopy software market in 2025 and is expected to grow to USD 0.11 billion by 2035, at a CAGR of 9.14% during 2026-2035. The growth in Latin America is driven by pharmaceutical, food, and mining labs in Brazil and Mexico.
Middle East & Africa: This region represented a 2.80% (USD 0.04 billion) share in the spectroscopy software market in 2025 and is expected to grow to USD 0.09 billion by 2035, at a CAGR of 9.14% during 2026-2035. The growth in the Middle East and Africa is driven by petrochemical, environmental, and pharmaceutical labs in Gulf countries and South Africa.
Analyst View: The regional market shares were calculated based on the installed base of instruments and software expenditure in each region. North America has the largest market share due to high R&D investment and compliance standards. Asia Pacific gets the largest growth premium due to growing pharmaceutical and testing capacity.
| Rank | Company Name | Market-Specific Revenue (USD Billion) | 2025 Share | Key Products / Business | Headquarters |
| 1 | Thermo Fisher Scientific | 0.21 | 16.54% | OMNIC, GRAMS and MS software | United States |
| 2 | Bruker | 0.13 | 10.24% | OPUS and TopSpin | United States |
| 3 | Agilent Technologies | 0.12 | 9.45% | MassHunter, Cary WinUV and OpenLab | United States |
| 4 | Waters | 0.10 | 7.87% | MassLynx, UNIFI and waters_connect | United States |
| 5 | SCIEX | 0.08 | 6.30% | SCIEX OS mass spectrometry software | United States |
| 6 | Shimadzu | 0.07 | 5.51% | LabSolutions spectroscopy software | Japan |
| 7 | Revvity | 0.04 | 3.15% | Spectrum and Syngistix software | United States |
| 8 | Sartorius | 0.04 | 3.15% | SIMCA chemometrics | Germany |
| 9 | ACD/Labs | 0.03 | 2.36% | Spectrus platform | Canada |
| 10 | Wiley | 0.02 | 1.57% | KnowItAll and spectral libraries | United States |
Note: Company revenues and shares are 2025 estimates.
Sources: Company press releases, expert interviews, secondary sources, Towards Healthcare database and Towards Healthcare analysts.
Thermo Fisher Scientific dominated the spectroscopy software market share with around 16.54% (USD 0.21 billion) of the 2025 revenues, followed by Bruker with 10.24% (USD 0.13 billion) and Agilent Technologies with 9.45% (USD 0.12 billion). Thermo Fisher Scientific dominates with its OMNIC and GRAMS molecular spectroscopy software and mass spectrometry software, including cloud-based solutions. Bruker offers OPUS for vibrational spectroscopy and TopSpin for NMR, while Agilent has MassHunter, Cary, and OpenLab software. Waters, SCIEX, Shimadzu, Revvity, Sartorius, ACD/Labs and Wiley participate through mass spectrometry software, LabSolutions, atomic and molecular spectroscopy software, SIMCA chemometrics software, vendor-neutral analytical data platforms and spectral libraries. The ten largest participants captured an estimated 66.14% (USD 0.84 billion) of 2025 revenues, whereas the rest of 33.86% (USD 0.43 billion) was owned by independent chemometrics and informatics vendors, instrument providers and open-source solutions. The spectroscopy software market is moderately concentrated, as there are instrument makers that combine software solutions with their instruments, and the competition takes place in terms of analysis capabilities, compliance, user-friendliness, vendor neutrality, cloud and artificial intelligence capabilities, libraries, and pricing strategies.
The spectroscopy software ecosystem links instrument makers, independent software and library providers, cloud and AI technology partners, integrators and laboratory users.
| Ecosystem Stage | Role in the Market | Key Companies |
| Instrument Makers | Supply instruments with control software | Thermo Fisher, Bruker, Agilent, Waters, SCIEX, Shimadzu |
| Independent Software | Provide chemometrics and vendor-neutral platforms | Sartorius (SIMCA), ACD/Labs, CAMO, Eigenvector |
| Libraries & Data | Supply reference spectral databases | Wiley, NIST |
| Cloud & Integration | Host data and integrate with LIMS and ELN | Cloud providers, LIMS vendors, integrators |
| End Users | Analyse spectral data | Pharma companies, chemical firms, food and environmental labs, universities |
Sources: Company press releases, expert interviews, secondary sources, Towards Healthcare database and Towards Healthcare analysts.
Key players in the spectroscopy software market have been mapped in the Towards Healthcare Companies Quadrant based on the strength of the market and innovation strategy, which includes size of revenue, market share, geographical presence, and breadth of product portfolio, R&D activities, and collaboration. Positions are based on the projected spectroscopy software revenue for each company in 2025 and technology/Cloud/AI and partnership capabilities.
Sources: Company press releases, expert interviews, secondary sources, Towards Healthcare database and Towards Healthcare analysts.
Leaders: Thermo Fisher Scientific, Bruker, Agilent Technologies, Waters and SCIEX combine large software revenue with broad instrument bases and advancing cloud and AI features.
Challengers: Shimadzu has large installed bases but less software differentiation.
Innovators: Sartorius, ACD/Labs and Wiley bring chemometrics, vendor-neutral data platforms and spectral libraries.
Niche Players: Revvity serves narrower technique segments.
By Deployment
By Technique
By Functionality
By Application
By Region
The spectroscopy software market was defined as instrument control, data analysis and chemometrics, spectral library, compliance, and data management software for infrared, Raman, mass spectrometry, NMR, UV-Vis, and other spectroscopy instruments on a global level. The base year 2025 was developed using a bottom-up approach through spectroscopy instrument installed bases by type of technology used, software attachments, and spending by deployment, function, application, and geography, and cross-verified using a top-down approach through revenues of leading instrument and software companies from their software and informatics segments. Allocation of segment, regional, and company values was made based on deployment types, technologies used, functions performed, applications, and regional demand. Important values have been cross-checked through company disclosures, regulatory and industry data, as well as third-party published estimates, and inconsistent input data was discarded. All segment, regional, and company values were normalized to the 2025 base year, and the 2026-2035 forecast, which uses a constant CAGR from the 2025 base, was recomputed and validated.
Analyst View: Spectroscopy software is moving away from licenses associated with instrumentation and into cloud-based subscriptions and AI-based analytics, driving higher growth than instrumentation alone. Our forecast is based on demand tied to the instrument installed base and software investment, thus tracking lab activities, regulation, and digitization. The key positives are cloud, AI, and Raman, while the negatives are validation expenses and cybersecurity.