



 Request Consultation
At a Glance of the U.S. Medicine Use
Today, the U.S. healthcare system is emerging into multiple pathways simultaneously, as Americans are employing more medicine than ever. This covers 210 billion days of therapy in 2025, which is 13% higher over five years, even though the acceleration has visibly slowed since 2024. Even after a landmark Medicare Part D reform lowered costs for one substantial group of patients, patient out-of-pocket costs reached a record $110 billion. In a single year, the system recorded that overall spending on medicines expanded 10.6%, which is more than double the market’s already-raised five-year average pace. Alongside, access barriers remain resolutely consistent, whereas roughly two-thirds of prescriptions for newly unveiled drugs remain unfilled in their first year on the market.
This summary is developed completely on IQVIA Institute's U.S. Medicine Use Trends 2026 report, published April 28, 2026, which indicates the pharmaceutical industry's definitive annual accounting of how Americans exactly use and pay for medicine. Beyond treating increasing costs or surging access, this briefing reflects the actual tension in the data, which includes real relief for some patients with an accelerating burden for others, speeding innovation coupled with constant unfilled prescriptions, and a market projected to remain rising even as its growth rate slows.
Emergence of Four Forces Simultaneously Transforms How Americans Use & Pay For Medicine
Across the United States healthcare system, rising medicine use, record out-of-pocket costs, persistent access barriers, and accelerating spending are collectively working at once. This further explains a system broadening in both benefits & complexity, such as:
- Rising Medicine Use: In 2025, the section reported 210 billion days of therapy, i.e. +1.5%.
- Record Out-of-Pocket Costs: This included $110 billion in 2025, i.e. up $6 billion.
- Persistent Access Barriers: The record shows 65% of new-drug scripts go unfilled in year one.
- Accelerating Spending: Net spending grew 10.6% in 2025 alone.
Not as sequential stages of a single story, these four forces are arising simultaneously and to some extent independently. This shows that policy interventions targeting any one of them, like the Medicare Part D cap underlining out-of-pocket costs, do not automatically overcome the others.
Source: IQVIA Institute for Human Data Science, U.S. Medicine Use Trends 2026, April 28, 2026.
However, Current Declining Growth, Total Medicine Use Has Expanded 13% in Five Years.
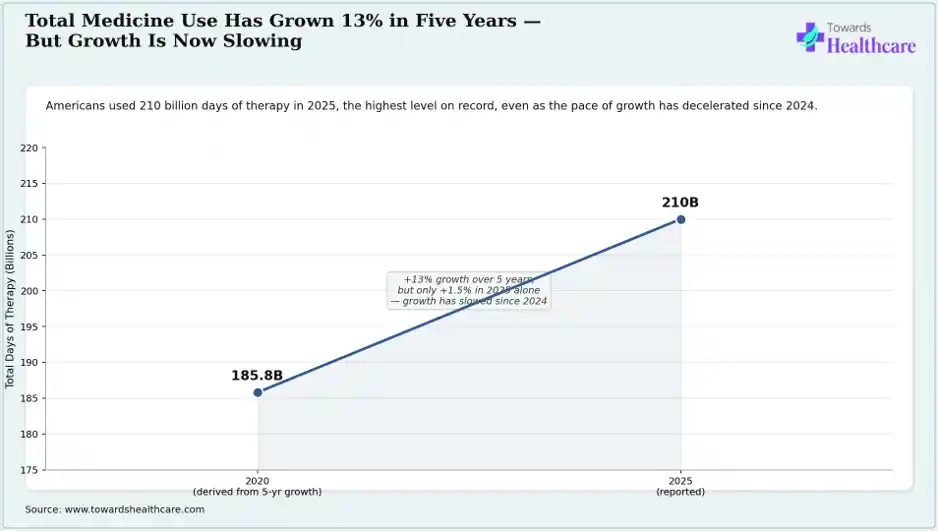
The above graph displays a comparison across total U.S. prescription medicine use, which is recorded in days of therapy, between a five-year-ago baseline & 2025’s measured total of 210 billion days.
Key Insight: Along with 185.8B in 2020 & 210B in 2025, the chart illustrates a slowdown from a strong multi-year growth trend to just 1.5% growth in 2025 alone. This is truly a new turning point, which is after years of notably progressing usage. A focus on the foundational volume driver of U.S. medicine spending is calming, even though dollar spending sustains accelerating; i.e. price and mix, not volume, are increasingly what's propelling the market.
Source: IQVIA Institute for Human Data Science, U.S. Medicine Use Trends 2026, April 28, 2026.
Retail Pharmacies Registered Dominance, While Non-Retail Settings Are Witnessing Rapid Expansion
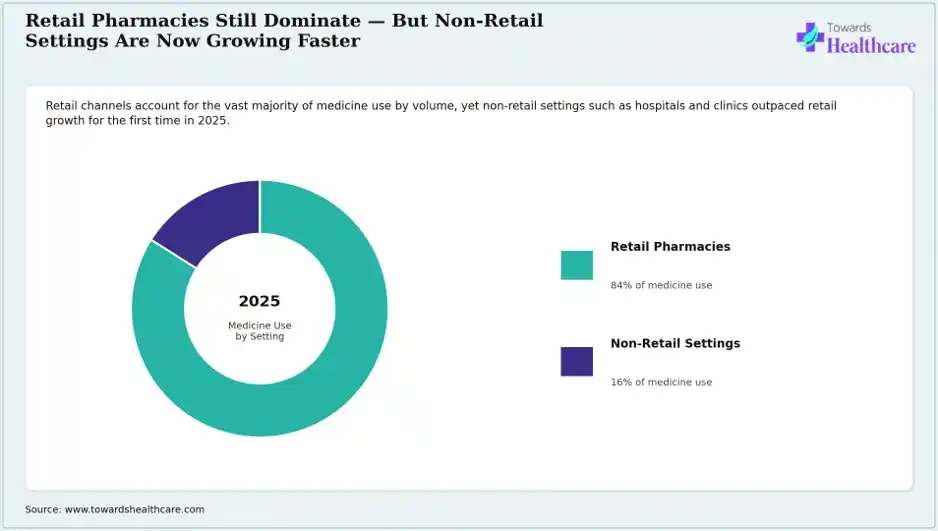
The above infographic showcases that retail pharmacies accounted for a major share of 84% of the total medicine use by setting in 2025 & non-retail settings held 16% of the medicine use share in 2025.
Key Insight: Regardless of the dominant setting, called retail pharmacies with an 84% share, non-retail settings are expanding at the fastest rate for the first time. Meanwhile, these shares indicate an impressive transition towards more medicine being leveraged in clinical settings instead of self-administered at home. This further shows the significance of the requirement for adaptation across how care delivery and reimbursement models are structured.
Source: IQVIA Institute for Human Data Science, U.S. Medicine Use Trends 2026, April 28, 2026.
Patient Out-of-Pocket Costs Attain a Record $110Billion in 2025
A key, revolutionary policy lowered costs for some patients, and aggregate out-of-pocket expenses on medicines hit a massive level ever reported. Certain recorded data encompasses:
- Total patient out-of-pocket costs in 2025: $110 Billion
- Increase in aggregate OOP costs vs. 2024: +$6 Billion
- Share of total OOP costs paid by commercially insured patients: 52%
These statistics show a surge year over year across the U.S. The share of commercially insured patients is currently supporting the majority of the record $110 billion in total OOP costs and results in cost-efficient translations in the U.S. healthcare policy. This frequently focuses on Medicare, which may be understated, and this actually covers the largest & fastest-growing share of the patient cost burden.
Source: IQVIA Institute for Human Data Science, U.S. Medicine Use Trends 2026, April 28, 2026.
In 2025, Medicare Patients Experienced Relief & Approximately All Other Members Paid More
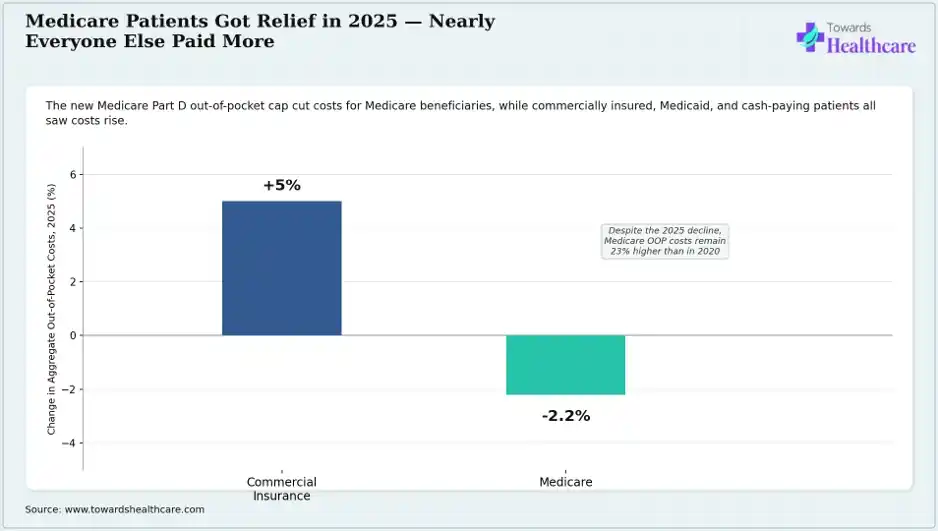
This graph reflects a comparison of the year-over-year change in aggregate out-of-pocket costs for commercially insured patients against Medicare beneficiaries, i.e. the only payer group to observe costs decrease in 2025.
Key Insight: Specifically, the Medicare Part D out-of-pocket cap is functioning exactly as developed for the population it targets. But the diversity between a 5% rise for commercial patients and a 2.2% decline for Medicare patients displays policy relief in U.S. drug pricing and remains strictly targeted instead of system-wide. In addition, improvement in Medicare still indicates beneficiaries paying 23% more than in 2020.
Source: IQVIA Institute for Human Data Science, U.S. Medicine Use Trends 2026, April 28, 2026.
Particularly for Novel Unveiled Drugs, Roughly Two-Thirds of Prescriptions Face Hurdles in Filling
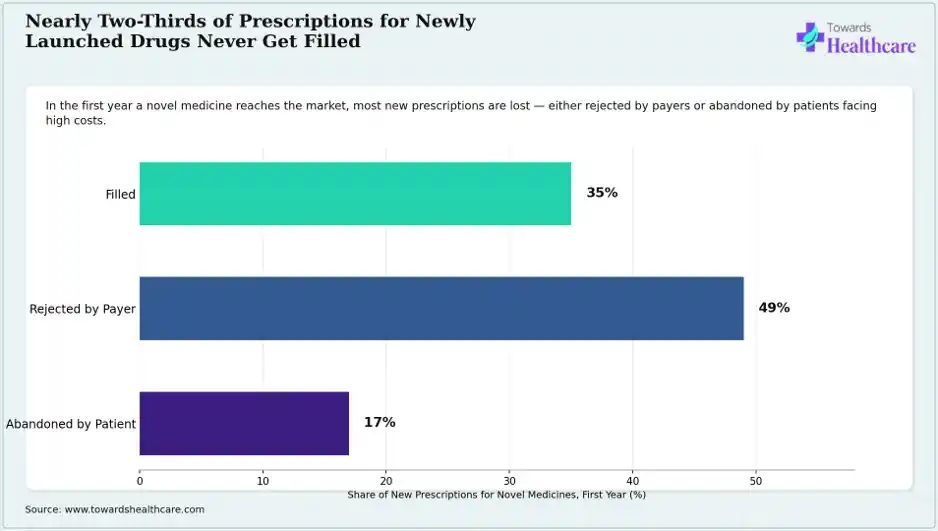
This graph displays the overall analysis of the outcome of first-year prescriptions for new medicines into three classes, such as filled, rejected by the payer, and abandoned by the patient after approval.
Key Insight: The prominent cause prescriptions remain unfilled is payer rejection with 49%, i.e. higher than patient abandonment with 17%. Alongside, a major access limitation for novel medicines is coverage and formulary decisions made proactive of the patient. This majorly shows that solutions are aimed only at lowering patient costs, which will recognize only part of the problem.
Source: IQVIA Institute for Human Data Science, U.S. Medicine Use Trends 2026, April 28, 2026.
Share Rolls: One Vaccine Category Held Approximately Majority of All Novel Prescriptions for Newly Launched Medicines
Especially a spotlight between 2020 & 2024, 99 novel medicines were introduced in the United States, but the RSV vaccine category alone captured two-thirds of first-year prescription volume. In detail, this includes:
- Novel medicines launched in the U.S. throughout 2020-2024: 99
- New prescriptions written in the first year of availability: 7M
- New Prescriptions were for RSV vaccines alone: 64%
These digits represent that the RSV vaccine category solely accounted for a major share, i.e. 64% of all-new prescription volume across 99 unveiled medicines. The fact discloses that aggregate ‘novel medicine uptake’ numbers can be increasingly distorted by one high-volume public health intervention. Meanwhile, the showcase for individually introduced specialty and rare disease therapies, which make up the bulk of the 99 rollouts, is notably more restricted.
Source: IQVIA Institute for Human Data Science, U.S. Medicine Use Trends 2026, April 28, 2026.
In a Single Year, the U.S. Medicine Spending Elevated $58 Billion.
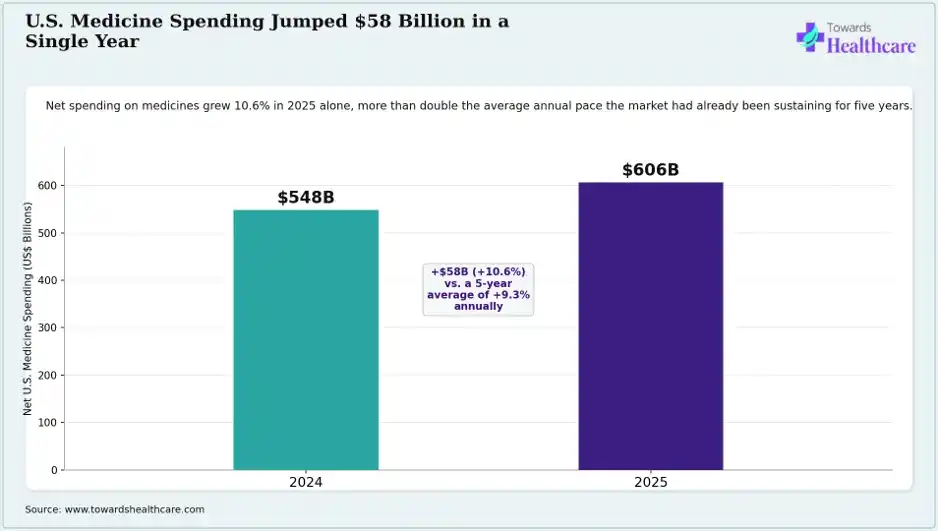
The chart presents a comparison of net U.S. medicine spending between 2024 and 2025, which describes a $58 billion rise & it outperformed the market’s already-raised five-year growth rate.
Key Insight: Net U.S. medicine spending in 2024 was $548 B, and in 2025 it was $606B, which expresses a 10.6% single-year growth rate against a 9.3% five-year average. This finally ensures 2025 was a genuine acceleration despite simply a continuation of the trend. This is mainly fueled by a specific, identifiable combination of factors, including GLP-1 uptake, new brand launches, and a rebound in protected-brand spending, instead of broad-based market-wide expansion.
Source: IQVIA Institute for Human Data Science, U.S. Medicine Use Trends 2026, April 28, 2026.
With the Outdated COVID Products From the Market, GLP-1 Drugs Are Forcing Higher Spending
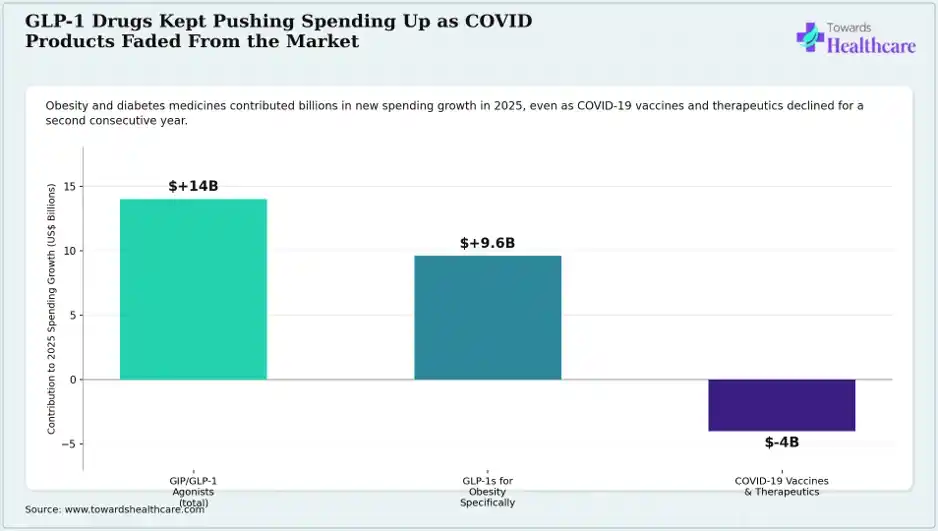
The graph represents a comparison across the dollar contribution of LIP/GLP-1 agonists (both total and obesity-specific) and COVID-19 vaccines/therapeutics to 2025's extensive spending progression.
Key Insight: As the chart indicates, GLP-1 obesity products alone captured $+9.6 billion, which is more than 2025 spending growth. Along with the total of GIP/GLP-1 agonists of $+14 billion, the comprehensive COVID-19 category subtracted $4 billion. Meanwhile, the obesity drug class has today entirely substituted COVID-19 medicines as the single largest identifiable catalyst of incremental U.S. medicine spending, a genuine modification of the guard in what's propelling the market.
Source: IQVIA Institute for Human Data Science, U.S. Medicine Use Trends 2026, April 28, 2026.
By 2030, Spending Surge Will Show Decline, But Still Include %200 Billion to the Market
In the coming era, patent expiries and pricing pressure are anticipated to slow down the acceleration of spending growth, even though consistent innovation adoption maintains the market progressing in absolute terms. As per IQVIA’s five-year projections,
- There will be a +$200 billion rise in net spending from 2025 to 2030.
- Through 2030, there will be a 4.5 to 7.5% annual net-price spending growth.
- In each year, nearly 50-55 new medicines are predicted to launch.
The future growth range of 4.5% to 7.5%, i.e. below 2025’s exact 10.6%, demonstrates that IQVIA estimated 2025 to be highlighted as a peak year rather than the new baseline. Although patent expiries and pricing pressure offer a genuine offset to continued innovation-driven spending rises.
Source: IQVIA Institute for Human Data Science, U.S. Medicine Use Trends 2026, April 28, 2026.
Periodic Market Enhances Access, But It Never Captures Up to Established Drugs
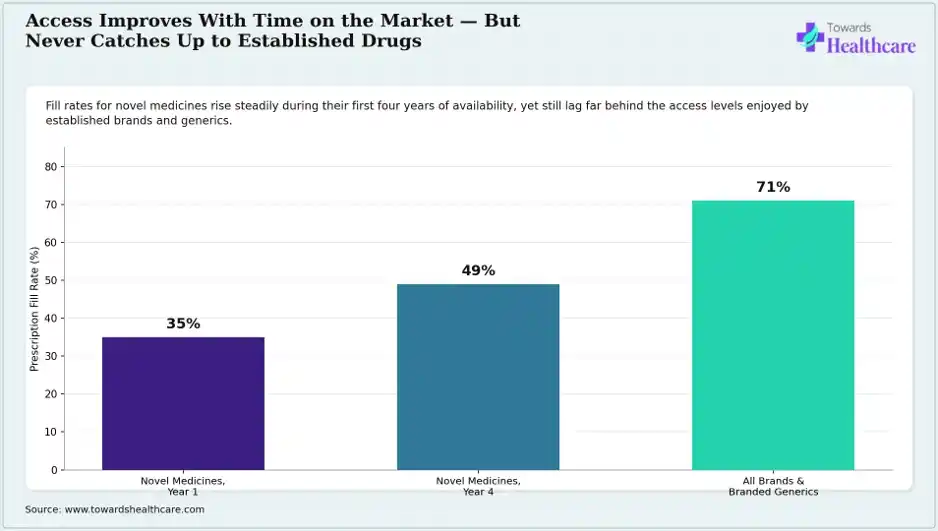
The chart depicts how prescription fill rates for novel medicines improve between their first & fourth year of availability and are further compared with the fill rate for all established brands & branded generics.
Key Insight: Along with the four-year improvements in payer coverage and physician familiarity, novel medicines' fill rate shows more than 20 percentage points below the baseline catered by established drugs. This ensures that the access gap for genuinely new therapies is not easily a temporary launch-year term but a multi-year structural framework.
Source: IQVIA Institute for Human Data Science, U.S. Medicine Use Trends 2026, April 28, 2026.
Exploring the Difference Between List-Price and Net-Price Growth Covers Where Rebates and Discounts Exist
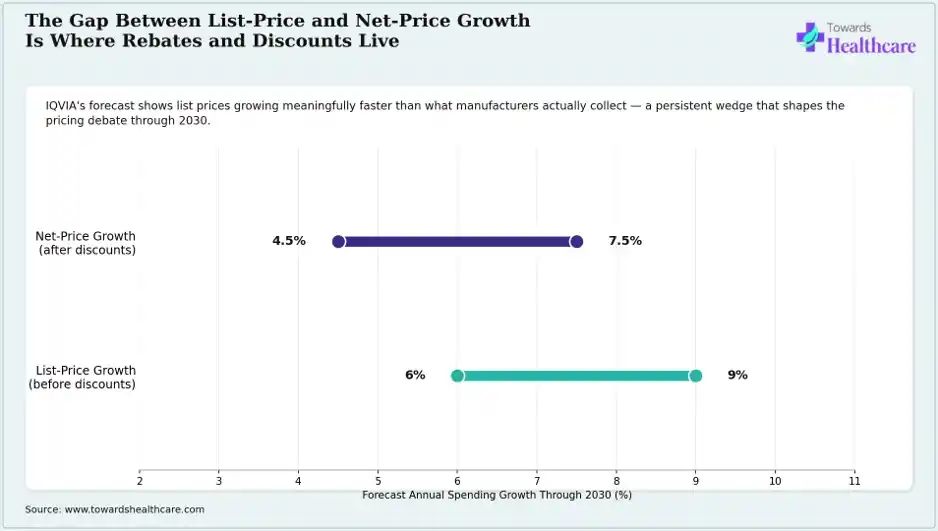
This graph declares a comparison of IQVIA’s forecast annual growth ranges for list-price spending (before manufacturer discounts and rebates) vs. net-price spending (after those concessions), through 2030.
Key Insight: The above indicates the consistent 1.5 -to-2- percentage-point gap between list-price & net-price growth forecasts through 2030 quantifies the scale of the rebate and discount system that places between what manufacturers barely charge & what they actually consolidate. The respective gap that remains core to continuous U.S. drug pricing policy debates accurately because so minimal of it is visible to patients at the pharmacy counter.
Source: IQVIA Institute for Human Data Science, U.S. Medicine Use Trends 2026, April 28, 2026.
Emergence of Three Forces Will Determine Whether the U.S. Medicine Access Difference Restricts by 2030
|
Innovation-Driven Spending Growth During the prospective year, 50-55 new medicines will foster higher spending even as growth declines. |
|
Uneven Policy Relief Significantly, the Medicare Part D cap assisted one group, whereas costs rose for everyone else. |
|
The First-Year Access Gap The industry shows 65% of new-drug scripts are still unfilled, massively due to cost & coverage. |
This further explores that innovation will maintain broadening the market even though its growth rate decreases. However, policy relief will similarly be sustained as targeted beyond universal coverage absent further legislative action. Whereas the first-year gap has proven that even if fill rates optimize with time, which shows that 2030's outcome will most likely be a development of current tensions instead of a subtle resolution of them.
Source: Synthesis of evidence presented in Sections 1-12 of this briefing, drawing on IQVIA Institute for Human Data Science, U.S. Medicine Use Trends 2026.
Recent Announcements Across Medicine Use in the United States in 2026
As per an order of President Donald Trump, generic drugs imported into the U.S. will confront zero tariffs for two years starting August 1, before a 100% levy takes effect in August 2028 and increased to 200% a year later.
Meanwhile, to bolster price transparency, the TrumpRX initiative was widened to list over 750 medications, supporting patients in comparing minimal benchmarked costs.
Latest Approvals in August 2026
- On August 19, 2026, the US FDA approved the first therapy for patients aged 8 and older with Glycogen Storage Disease Type Ia.
- On August 6, 2026, approved an innovative engineered viral immunotherapy for treatment-resistant advanced melanoma.
- On August 5, 2026, FDA approved the first drug targeting the full range of narcolepsy type 1 symptoms.
Key Companies & Organizations
| Organization | Category | Relevance to U.S. Medicine Use Trends 2026 |
| IQVIA Institute for Human Data Science | Data & Intelligence Provider | They generally publish the annual U.S. Medicine Use Trends report, the prominent source for this briefing's usage, spending, and access data. |
| Centers for Medicare & Medicaid Services (CMS) | Federal Regulator | This oversees the Medicare Part D out-of-pocket cap, the major 2025 policy reform lowering costs for Medicare beneficiaries. |
| Eli Lilly and Company | Eminent Pharma/Obesity Leader | This is a developer of leading GIP/GLP-1 obesity and diabetes medicines fueling a substantial share of 2025 spending growth. |
| Novo Nordisk | Eminent Pharma/Obesity Leader | This player co-leads the GLP-1 category with Eli Lilly, and further collaboratively registers the bulk of obesity-related spending growth. |
| Pharmacy Benefit Managers (PBMs) | Payer Intermediary | It is central to prescription rejection & formulary decisions that propel the 49% payer-rejection share of unfilled new-drug scripts. |
| Retail Pharmacy Chains | Dispensing Channel | This indicates 84% of total U.S. medicine use by volume, the dominant setting for prescription dispensing. |
| Vaccine Manufacturers (RSV vaccine makers) | Vaccine Developers | This jointly holds 64% of all new prescriptions for novel medicines unveiled throughout 2020-2024. |
Strategic Business & Research Questions
- Which specific therapeutic categories beyond GLP-1s and RSV vaccines are seeing the steepest declines in first-year prescription fill rates, and what differs them from higher-performing launches?
- How does the 49%-payer-rejection rate for novel medicines vary by payer type, such as commercial, Medicare Advantage, Medicaid managed care, & which payer categories are the most restrictive?
- What is the realistic probability that the Medicare Part D out-of-pocket cap gets extended or expanded to other payer types via future legislation, and what would the fiscal impact be?
- Which specific manufacturers have robust patient assistance and copay support programs, and how effectively do those programs offset the 17% patient-abandonment rate for new prescriptions?
- How does the growth path of non-retail medicine use break down by site of care, including hospital outpatient, physician office infusion, vs. specialty pharmacy?
- What proportion of the projected $200 billion 2025-2030 spending increase is attributable to GLP-1/obesity products specifically, against the expansive pool of 50-55 annual new launches?
- Which rebate and discount mechanisms capture a dominant share of the persistent 1.5-2 percentage point gap between list-price and net-price spending growth projections?
- How does prescription abandonment behavior vary by patient income level and insurance type, and which specific out-of-pocket cost thresholds trigger the highest abandonment rates?
- What is the realistic timeline for fill rates on newly launched specialty and rare disease medicines (excluding RSV vaccines) to reach the 71% baseline enjoyed by established brands?
- Which pharmacy benefit manager formulary and utilization management practices are most directly responsible for the 49% payer-rejection rate, and how do practices differ across the three largest PBMs?
- How does the deceleration in total prescription volume growth, i.e. 13% over 5 years but only 1.5% in 2025, correlate with demographic, employment, or insurance coverage trends?
- What is the probability-adjusted forecast for whether U.S. medicine spending growth reaches the low end (4.5%) or high end (7.5%) of IQVIA's 2030 forecast range, based on current policy trajectory?
- Which therapeutic areas among the 50-55 annual new launches through 2030 are anticipated to evolve the largest individual spending contributions, based on current late-stage pipeline data?
- How does out-of-pocket cost growth for cash-paying patients (uninsured or choosing not to use insurance) compare to insured patients, and what specific products drive that segment's cost growth?
- What is the realistic impact of continued patent expiries through 2030 on net spending growth, and which specific blockbuster products face loss of exclusivity in this window?
- How concentrated is the $9.6 billion in obesity-specific GLP-1 spending growth among the top products, such as Wegovy, Zepbound, and emerging oral competitors, and how might that concentration shift by 2027?
- Which specific state Medicaid programs have implemented the most effective interventions to reduce prescription abandonment rates among their beneficiary populations?
- What is the realistic addressable opportunity for point-of-prescribing benefit verification technology to reduce the 49% payer-rejection rate for novel medicines?
- How does the growth rate for non-retail medicine use compare across different regions of the U.S., and which markets are furthest along in this site-of-care shift?
- Which specific policy interventions beyond the Medicare Part D cap are most likely to be enacted before 2030, and what would their projected impact be on the $110 billion out-of-pocket cost baseline?
Data & Intelligence Pointers
- Total U.S. prescription medicine use reached 210 billion days of therapy in 2025, up 1.5% year-over-year and 13% over the last five years, though growth has slowed since 2024.
- Retail pharmacies account for 84% of U.S. medicine use by volume, with non-retail settings displaying the remaining 16%, & non-retail growth spanned retail growth for the first time in 2025.
- Patient out-of-pocket costs for medicines reached a record $110 billion in 2025, an increase of $6 billion over 2024.
- Commercially insured patients hold 52% of total U.S. patient out-of-pocket medicine costs, with aggregate costs for this group rising 5% in 2025 & 37% over five years.
- The Medicare Part D out-of-pocket cap reduced aggregate Medicare beneficiary costs by $638 million (2.2%) in 2025, though Medicare out-of-pocket costs remain 23% ($5.3 billion) higher than in 2020.
- Of 7 million new prescriptions written in the first year for 99 novel medicines launched between 2020 and 2024, only 35% were filled: 49% were rejected by payers and 17% were abandoned by patients.
- RSV vaccines accounted for 64% of all first-year new prescriptions across the 99 novel medicines launched between 2020 and 2024.
- By the fourth year on the market, novel medicine fill rates improve to 49%, still far below the 71% fill rate for all established brands & branded generics.
- U.S. net medicine spending grew 10.6% in 2025, rising from $548 billion in 2024 to $606 billion, which is more than double the market's 9.3% five-year average annual growth rate.
- GIP/GLP-1 agonists contributed $14 billion to 2025 spending growth, with $9.6 billion specifically from obesity-approved products; COVID-19 vaccines and therapeutics declined by $4 billion over the same period.
- U.S. medicine spending at net prices is forecast to grow 4.5% to 7.5% per year through 2030, or 6% to 9% at list prices, adding roughly $200 billion to the market by 2030.
- An average of 50 to 55 new medicines are predicted to be unveiled annually through 2030, ranging across oncology, immunology, & specialty areas, coupled with traditional diabetes, obesity, and neurology treatments.
References
- IQVIA Institute for Human Data Science. “U.S. Medicine Use Trends 2026: Increased use and spending amid access and cost pressures.” Published April 28, 2026. Used for: all usage, spending, out-of-pocket cost, access, and forecast data presented throughout this briefing. https://www.iqvia.com/insights/the-iqvia-institute/reports-and-publications/reports/us-medicine-use-trends-2026.
- AJMC (American Journal of Managed Care). “IQVIA Report Highlights Shifts in Medicine Use, Spending Across Therapy Areas.” Used for: contextual background on IQVIA Institute's annual reporting methodology and historical report findings.
- IQVIA. “Global Medicine Use Trends 2026.” Webinar and report summary, February 25, 2026. Used for: global market growth context supporting the U.S.-specific findings in this briefing.