
Healthcare industry markets require a fundamentally different analytical framework from pharmaceutical markets. Demand here is driven not by patient treatment protocols, but by infrastructure utilization - testing activity, procedure volumes, installed equipment, and technology adoption cycles. Our methodology is built around these realities, integrating eight independent research streams before any market estimate is produced.
Final market estimates are published only after all independent methodologies are reconciled and validated against primary research and healthcare infrastructure data.
Sequential process - each stage is independently executed before reconciliation and final publication
Define scope, objectives, and analytical boundaries. Identify target geographies, technology segments, and end-user categories. Select appropriate sizing methodologies and establish data requirements before engagement begins.
Build the evidence foundation across healthcare infrastructure, technology landscapes, commercial structures, and regulatory environments.
Capture intelligence through structured and semi-structured discussions with industry participants and domain experts.
Build market value upward from end-user demand and utilization metrics using facility-level data and pricing models.
Healthcare industry markets require a distinct analytical lens. Unlike pharmaceutical markets - where demand follows patient treatment pathways - demand in diagnostics, devices, digital health, and life sciences is fundamentally tied to infrastructure utilization, equipment deployment, and technology adoption cycles. The methodology is designed around these structural differences.
Mapping of healthcare facilities, diagnostic laboratories, reference labs, research institutes, academic medical centers, ambulatory facilities, and specialty clinics. Understanding the structural capacity of the healthcare system – how many facilities, what equipment, and what service volumes they support.
Evaluating actual demand through testing volumes, procedure counts, equipment usage rates, sample processing throughput, and patient-facing service demand. Distinguishing between theoretical installed capacity and the commercially relevant, actually delivered volume.
Understanding purchasing behavior, procurement cycles, pricing models, technology replacement decisions, reimbursement frameworks, and the pace of adoption for new technologies-from pilot deployments through mainstream diffusion. Forecasting how adoption trajectories will shape revenue generation.
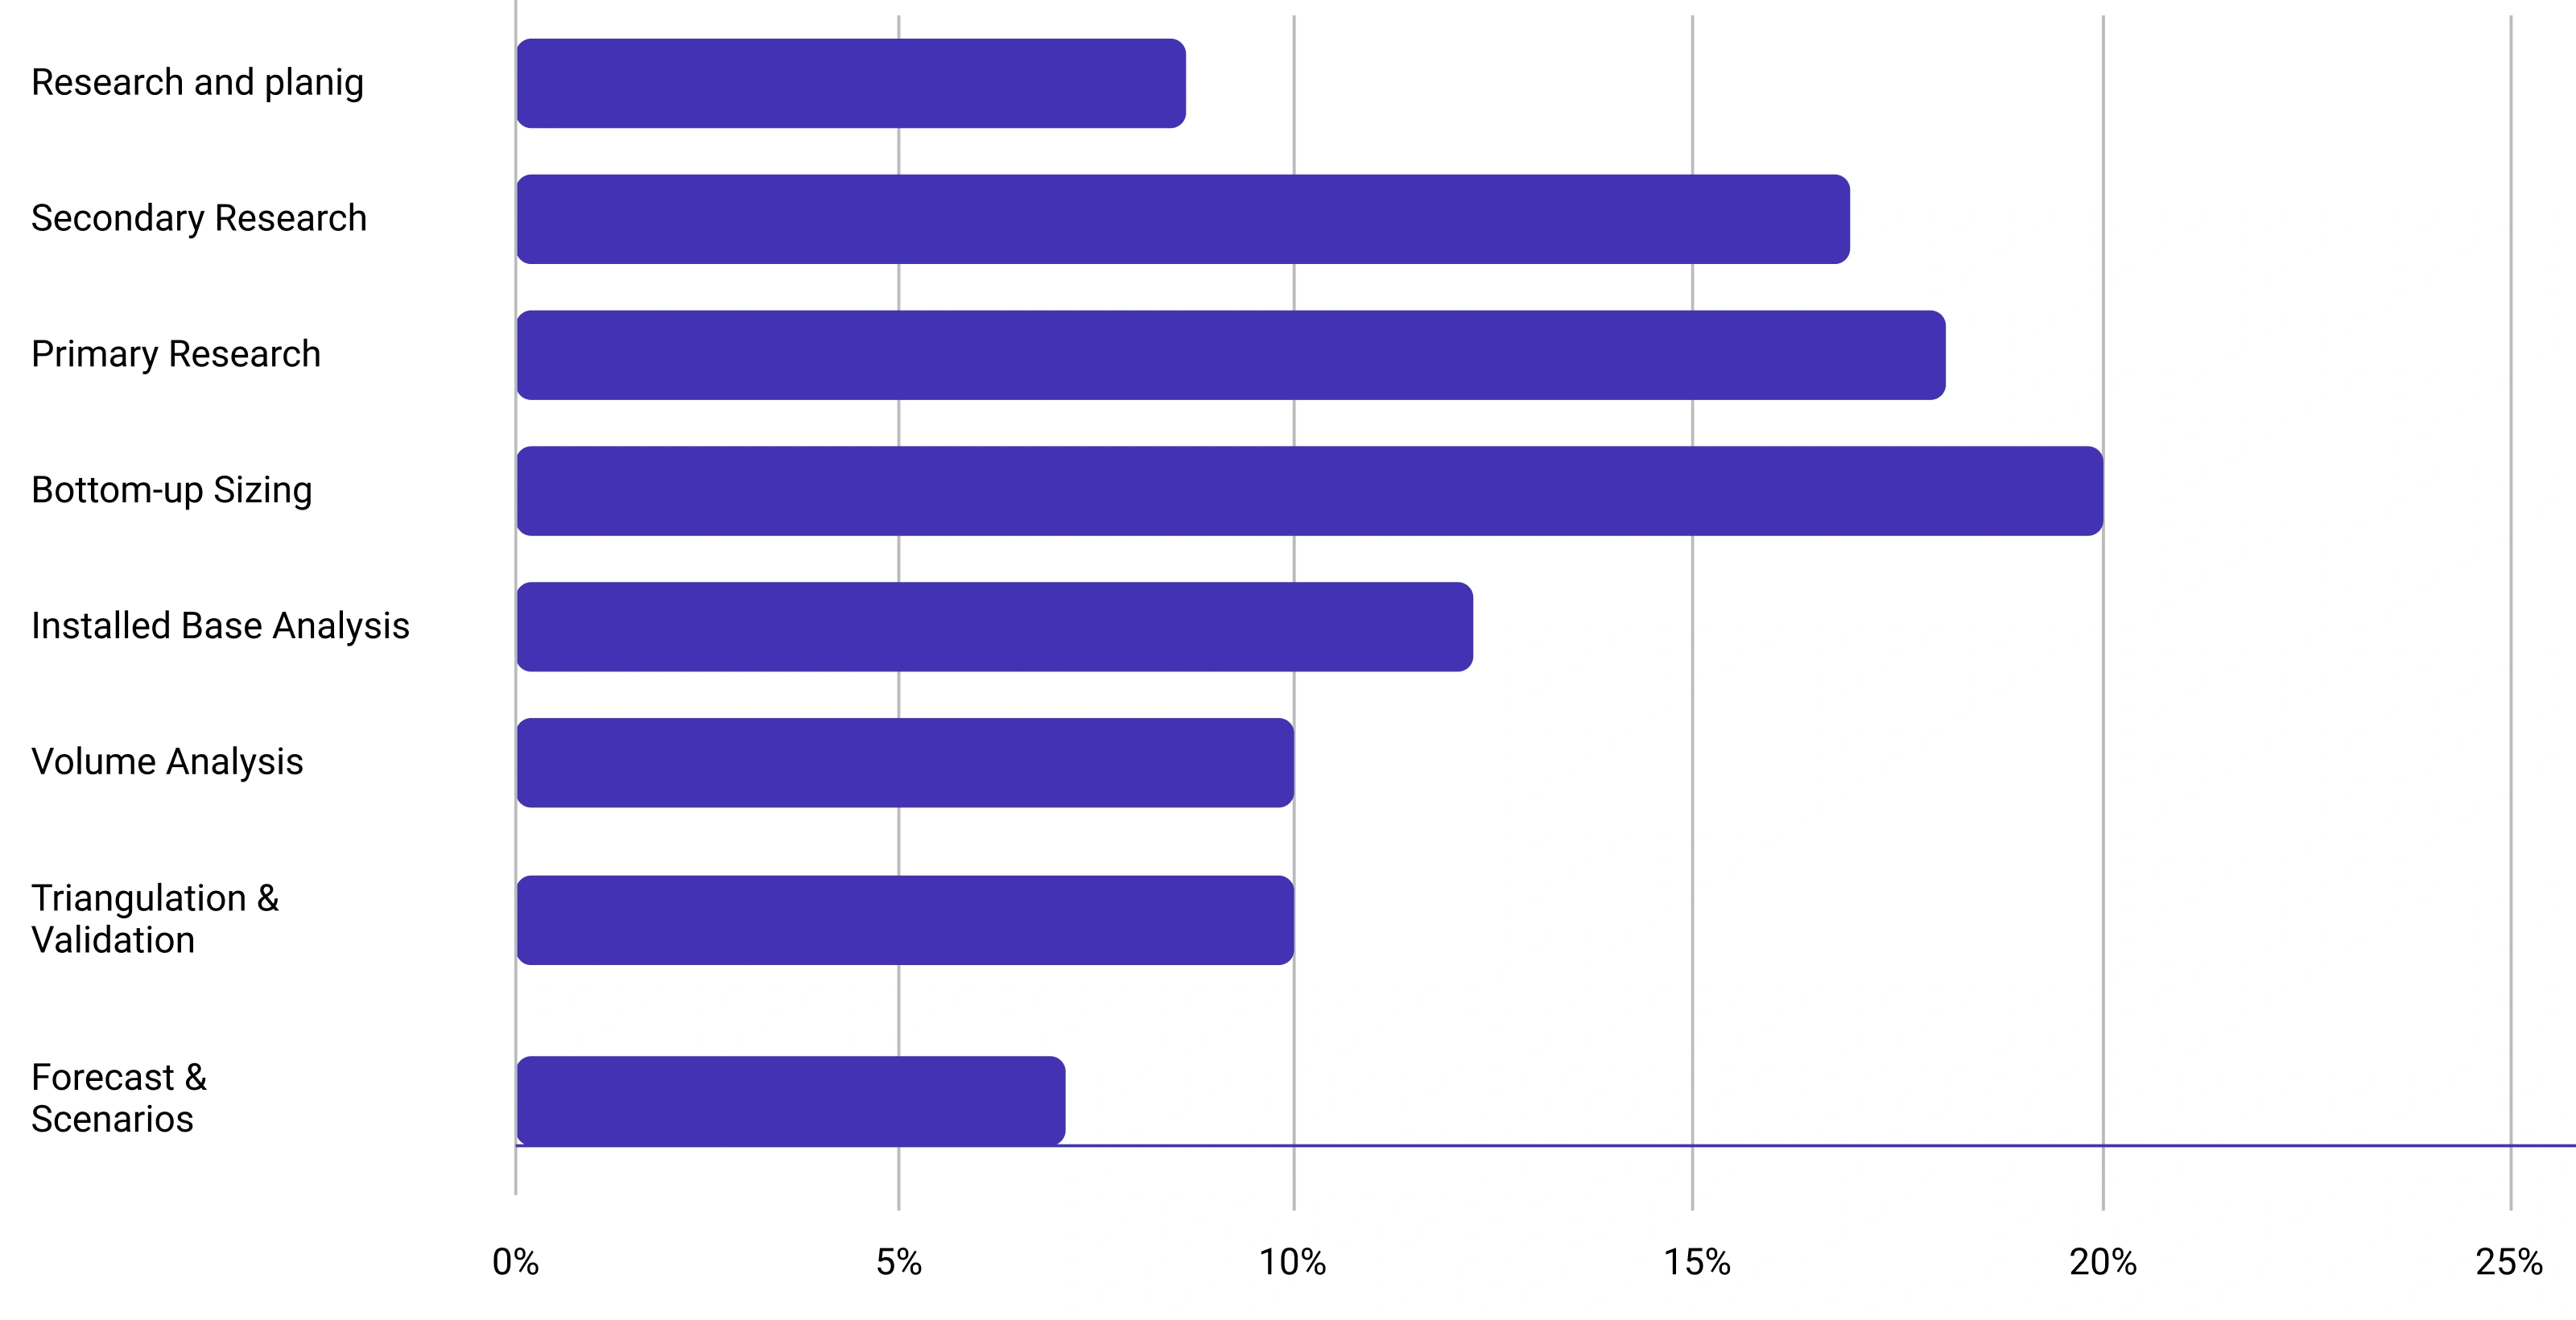
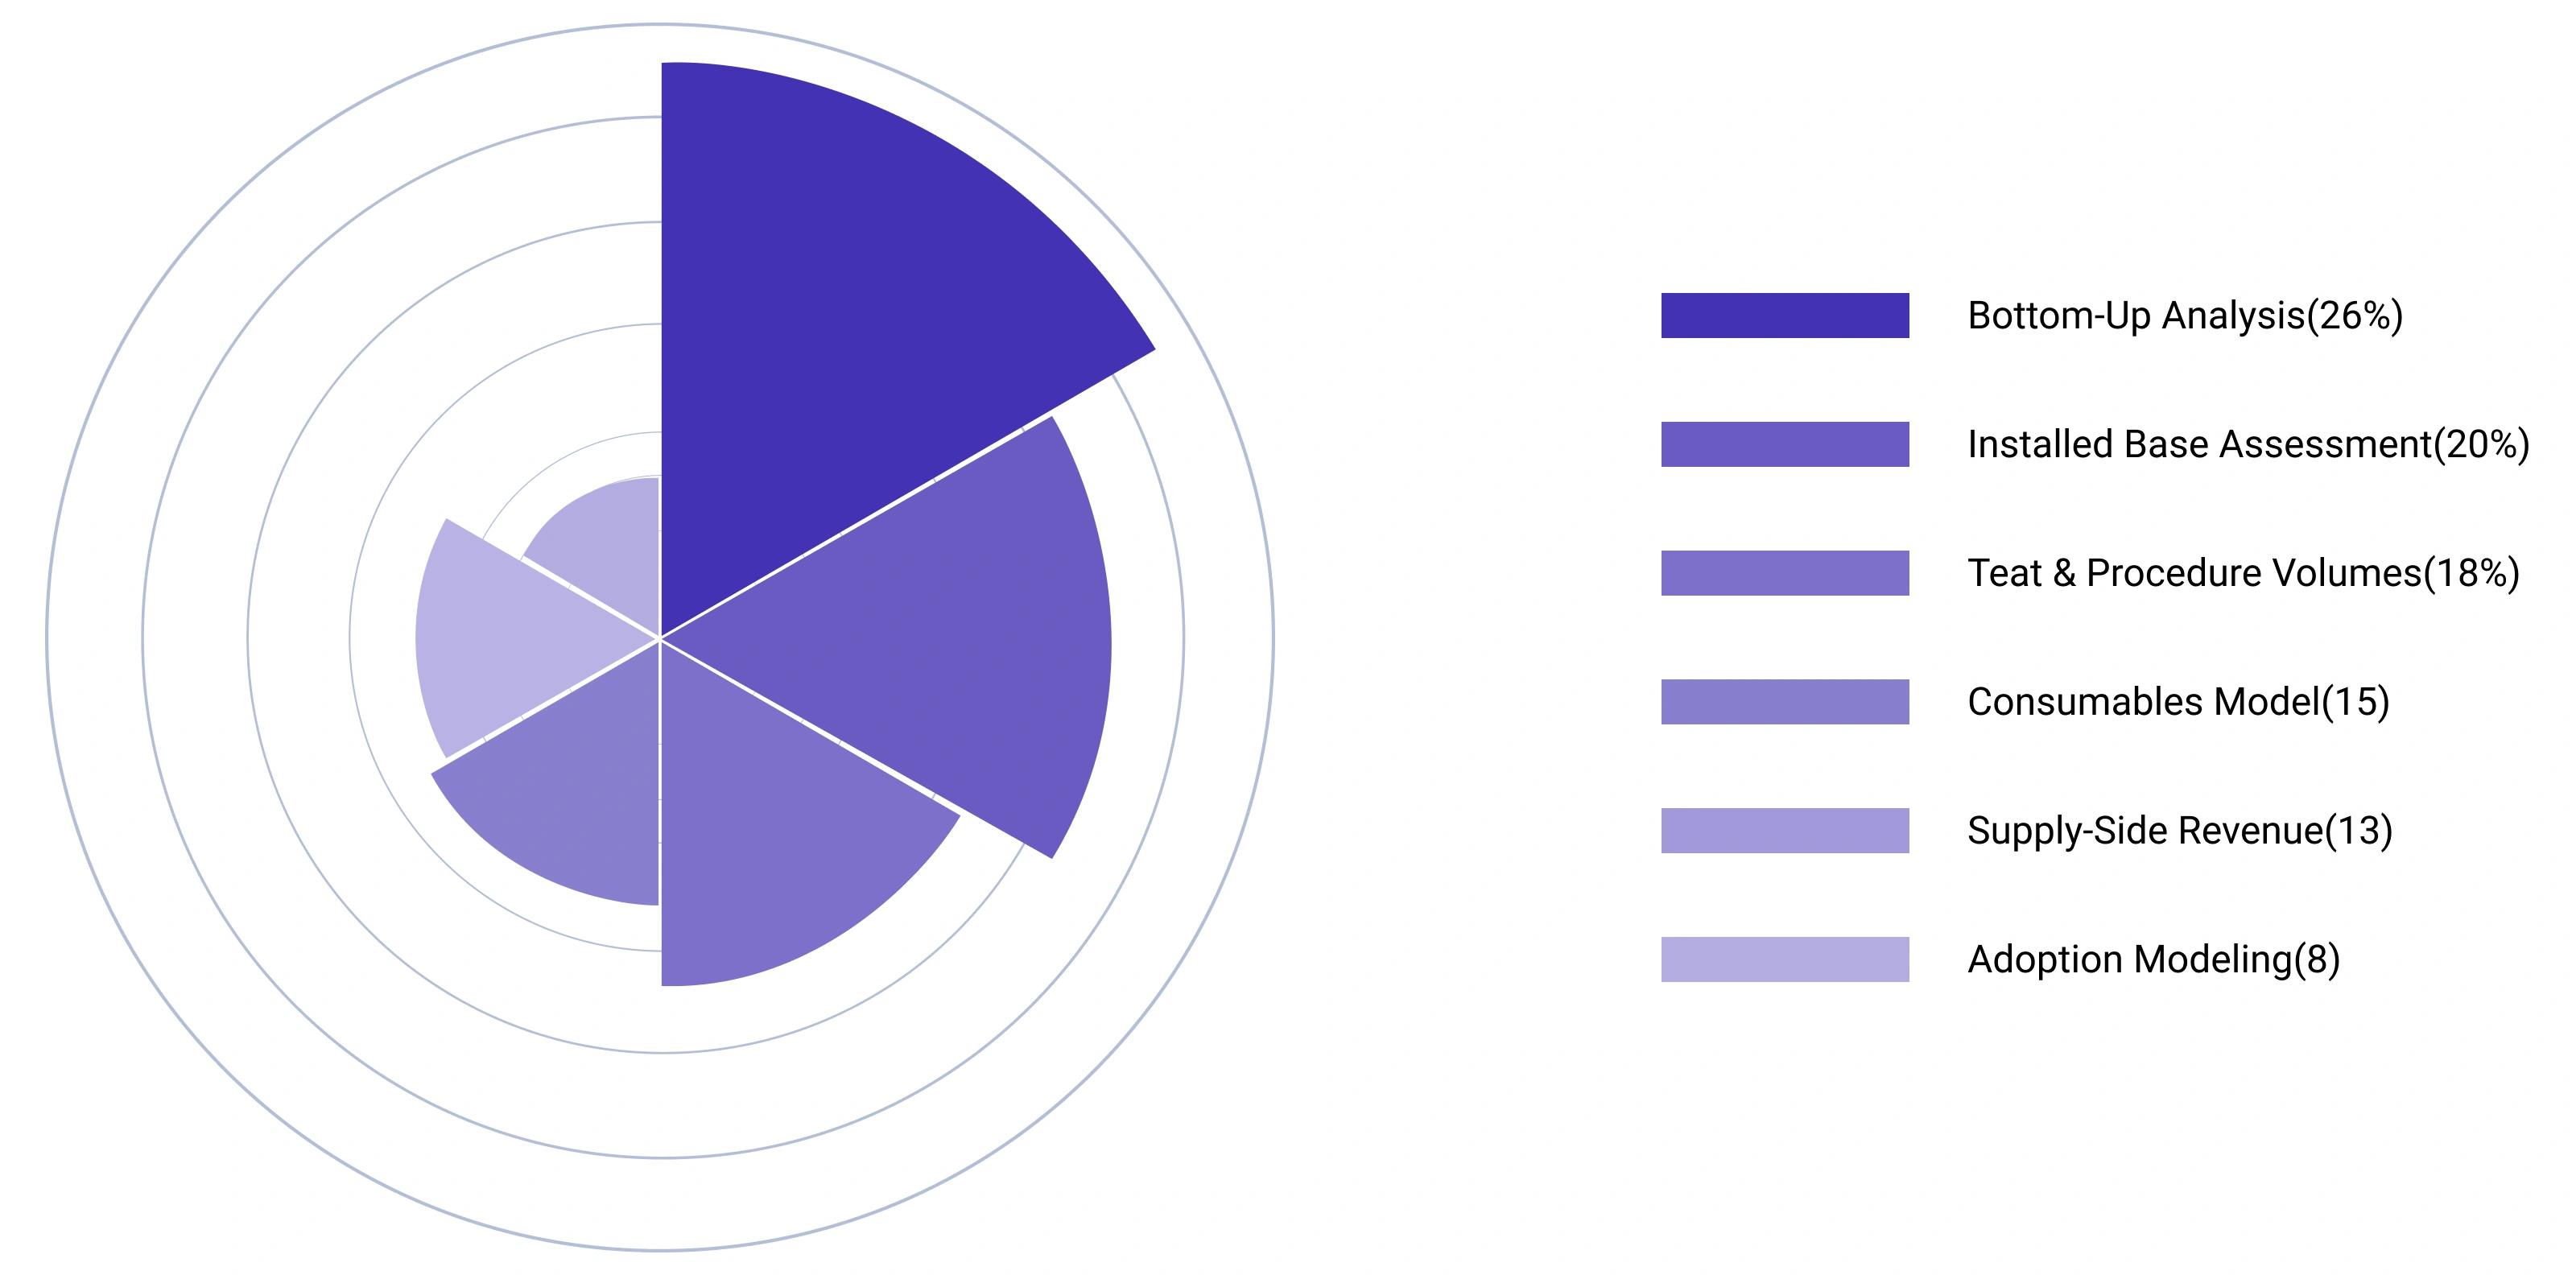
Relative emphasis across six analytical dimensions in the pharmaceutical research framework
Secondary research establishes the evidence foundation across healthcare infrastructure, technology landscapes, commercial structures, and regulatory environments. Conducted before any primary engagement, it builds the baseline assumptions that govern all subsequent modeling. Every source is evaluated for credibility, recency, geographic relevance, and methodological soundness before inclusion.
Hospital networks, diagnostic laboratory density, reference laboratory operations, research institutes, academic medical centers, and ambulatory care facilities. Capacity metrics, geographic distribution, and public versus private sector breakdown across target geographies.
Current technology platforms and emerging innovations. Product development pipelines, technology replacement cycles, standard-of-care platforms, and disruptive technologies in evaluation or early deployment. Assessment of legacy platform penetration and future substitution timelines.
Pricing structures across hospital, laboratory, and institutional channels. Tendering and procurement frameworks, budget allocation processes, group purchasing organization dynamics, and healthcare expenditure trends. Reimbursement rates and coverage policies for devices, tests, and services.
Device and diagnostics regulatory approvals (FDA, CE-IVD, CDSCO, TGA). Quality standards, accreditation requirements, post-market surveillance obligations, and compliance frameworks. Assessment of regulatory timelines and market access barriers across priority geographies.
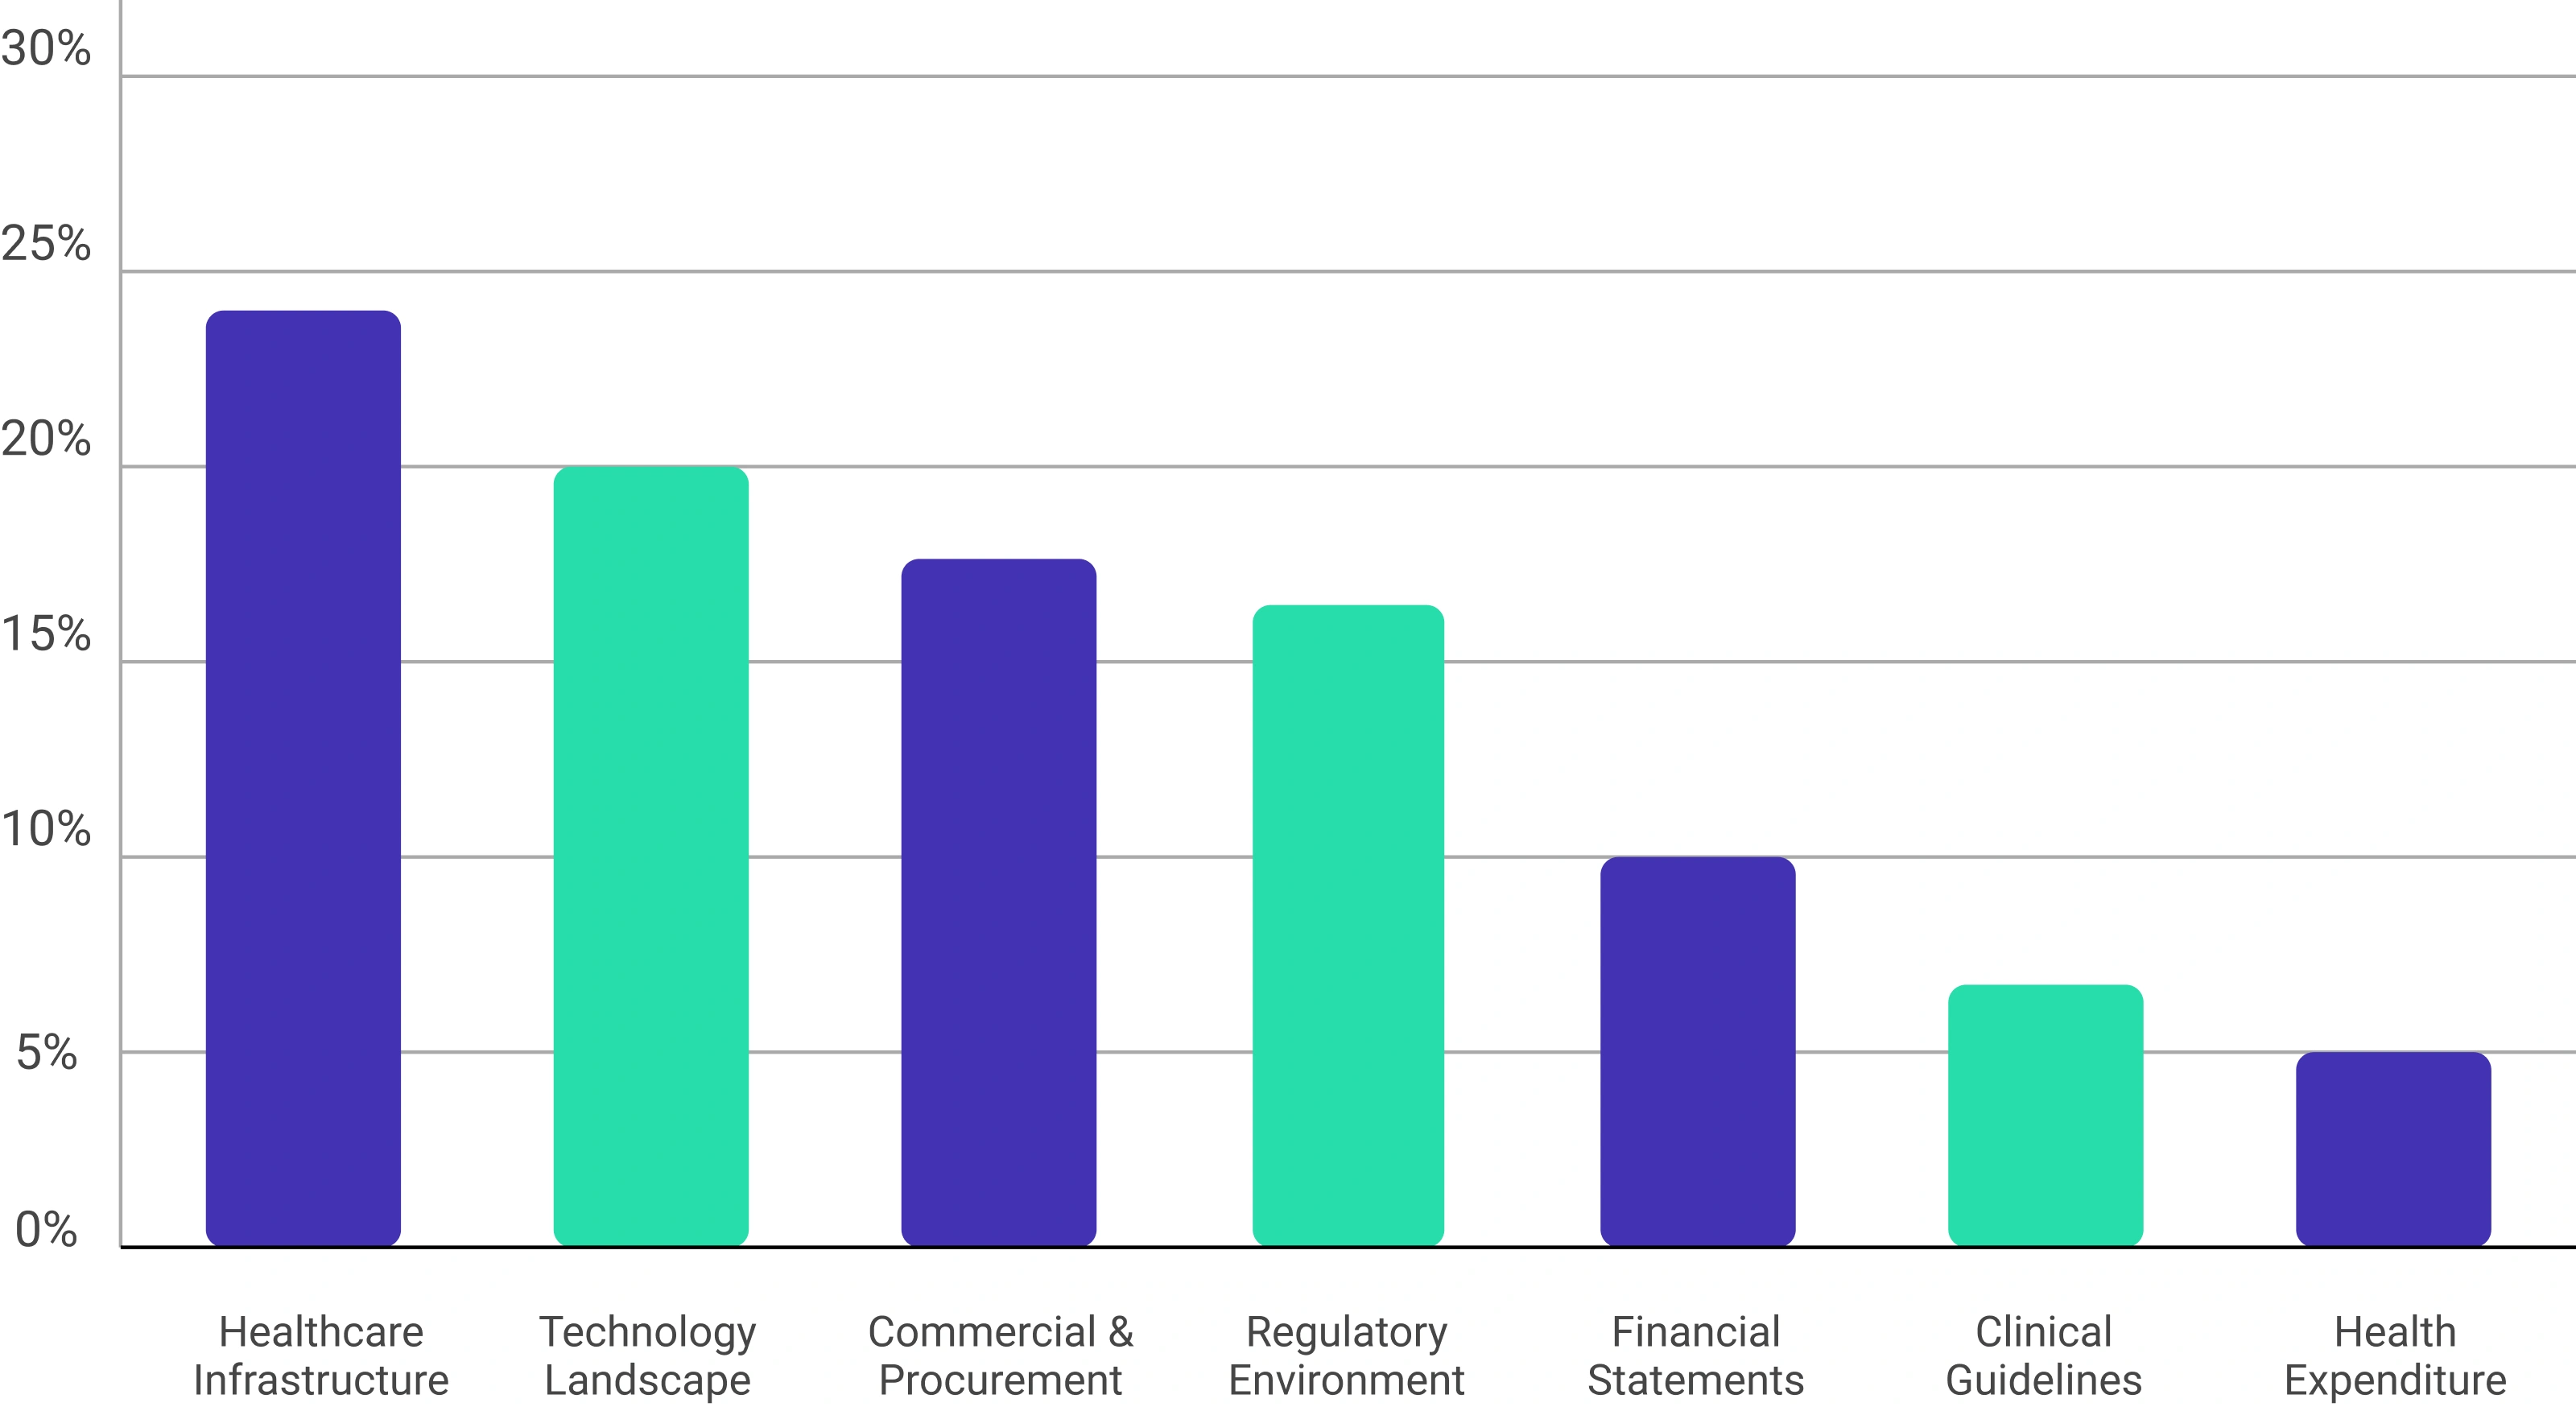
Relative coverage weight assigned to each data source category during secondary research
Primary research captures market intelligence that no database, registry, or published report can provide. It is deployed to validate assumptions on real-world purchasing behavior, utilization patterns, technology preferences, and future capital investment priorities - directly from the stakeholders who procure, operate, and evaluate healthcare technologies.
Testing volumes, equipment utilization rates, technology adoption decisions, service capacity, procurement timelines, and unmet needs. Understanding how laboratories and clinical departments make purchase and upgrade decisions in practice.
Capital equipment budgets, procurement cycles, vendor selection criteria, tendering processes, service contract preferences, and replacement cycle planning. Understanding institutional purchasing dynamics beyond the clinical level.
Instrument utilization in research settings, consumables consumption patterns, funding-driven purchase behavior, grant cycles, and awareness of emerging technology alternatives.
Technology manufacturer perspectives on market demand, competitive positioning, adoption barriers, pricing evolution, channel strategy, and forward-looking investment activity across target product categories.
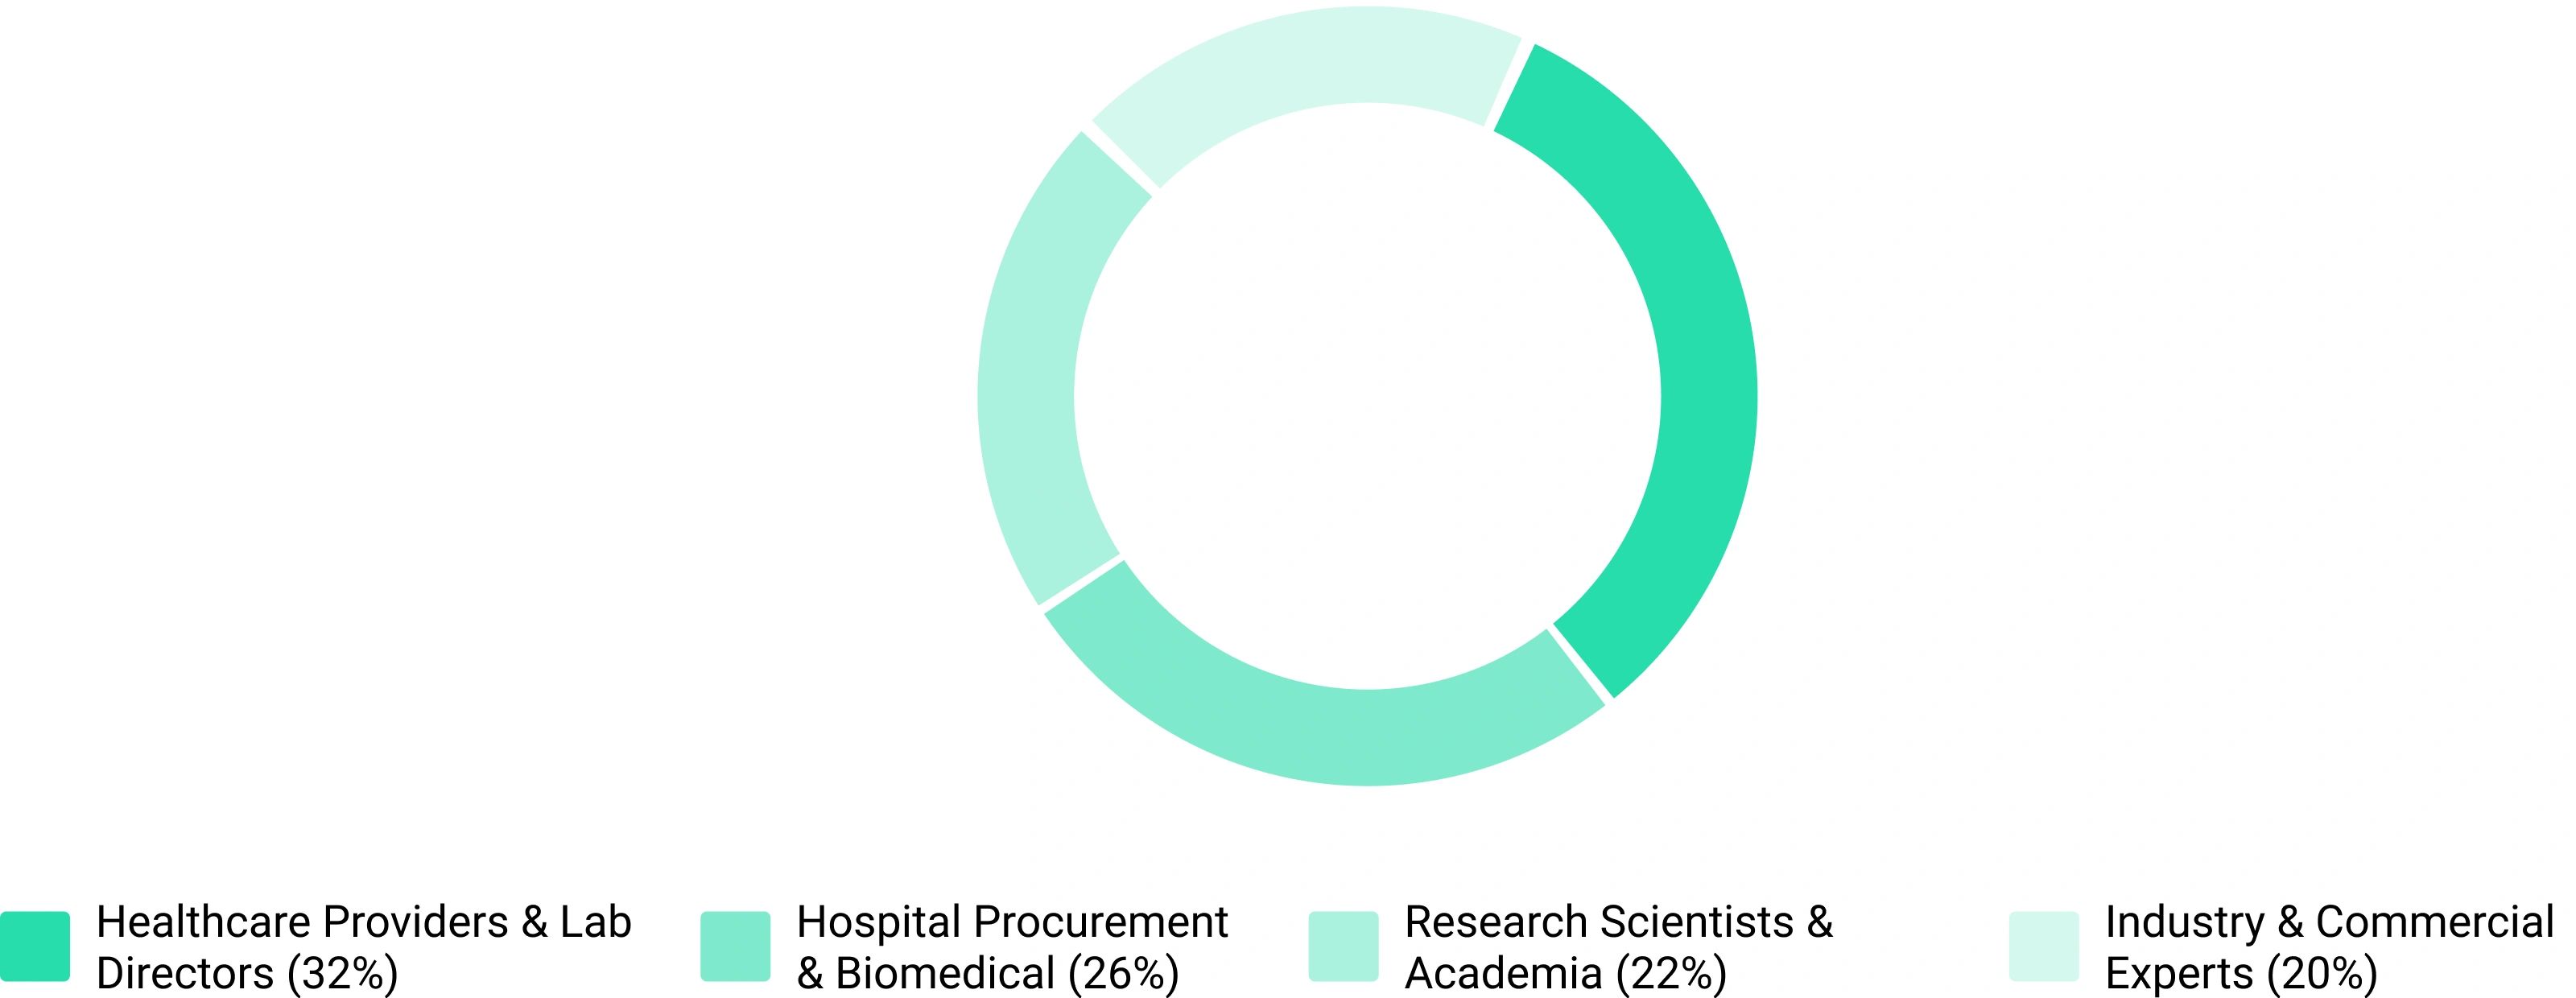
Typical proportion of stakeholder engagement across a standard healthcare technology market study
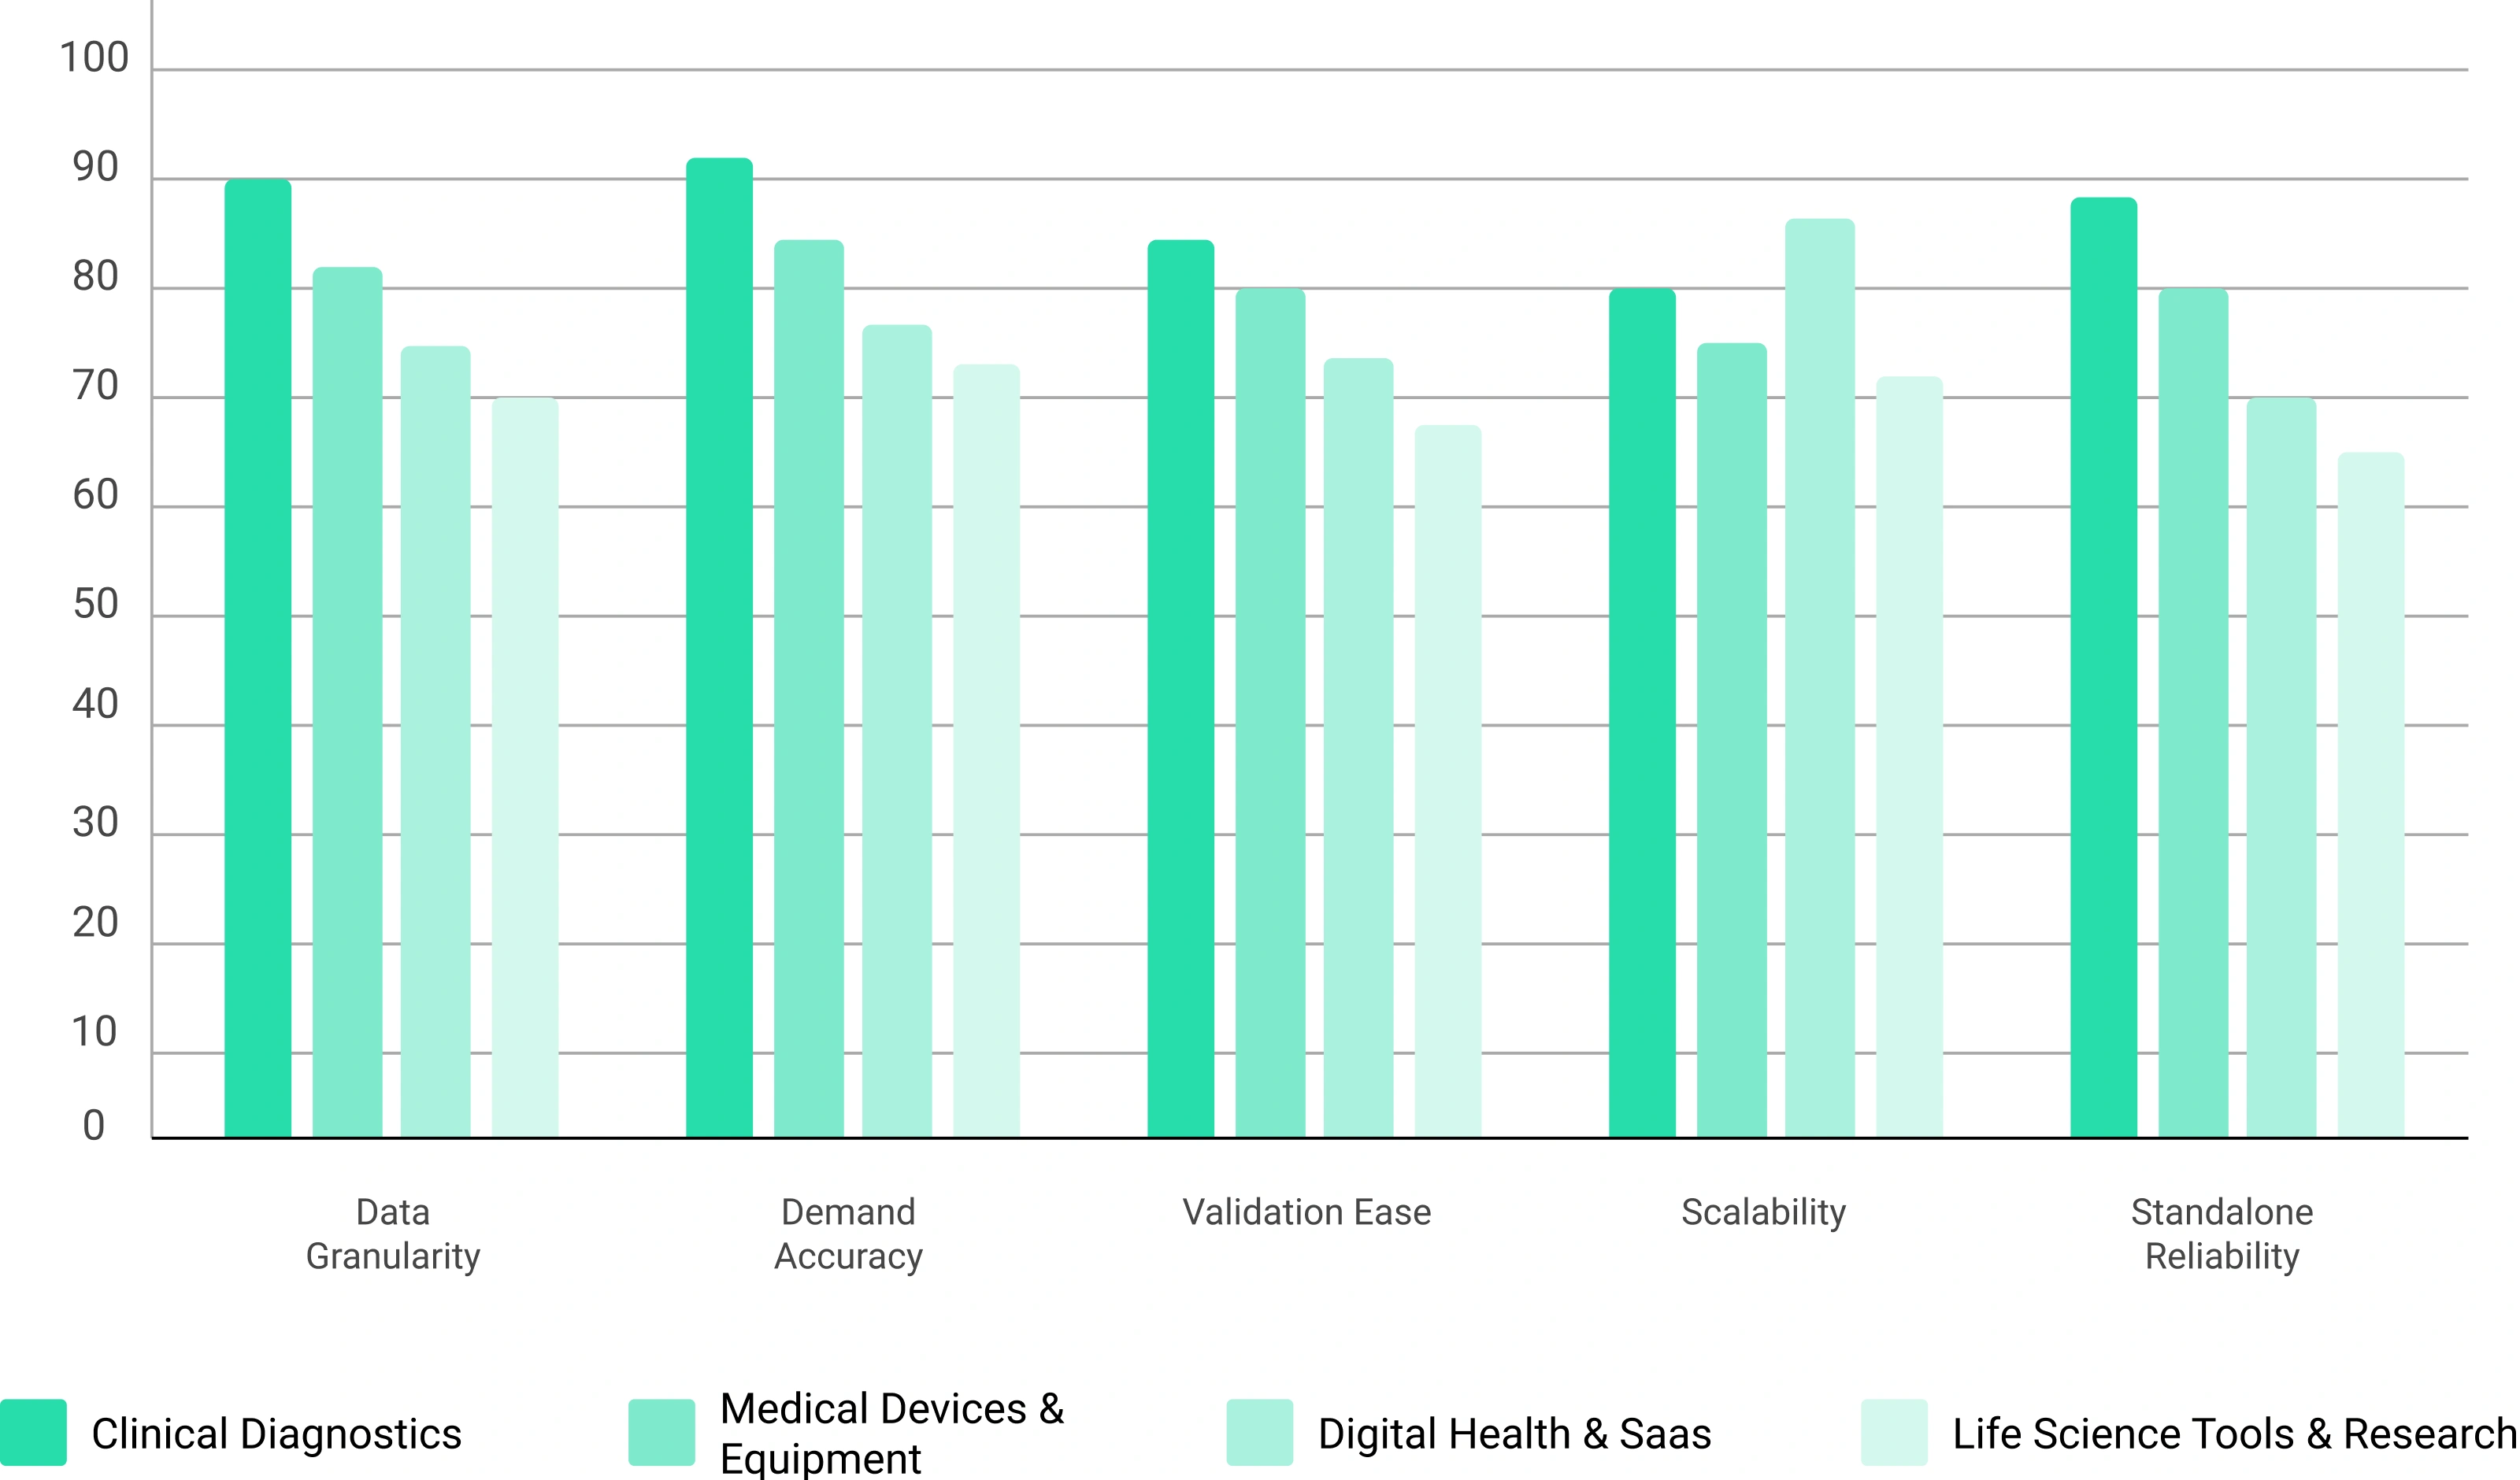
Bottom-up estimation is the primary market sizing methodology for healthcare technology markets. It begins with end-user demand at the facility or equipment level and builds market value upward through utilization metrics and pricing structures. This produces the most realistic representation of actual market demand - grounded in how healthcare systems actually purchase and use technology.
Relative applicability score of each bottom-up model across five assessment criteria
Many healthcare technology markets are built on a foundation of durable equipment with multi-year replacement cycles. Understanding the installed base - its size, age profile, and utilization intensity - is essential to accurately estimating both the capital equipment market and the recurring revenue streams that flow from it.
Total count of active instruments and systems currently deployed across healthcare and research settings, segmented by geography, facility type, and technology generation.
New installations from expanding healthcare infrastructure, greenfield facilities, and technology upgrades. Differentiated from pure replacement to identify genuine market expansion.
Average equipment lifespan derived from manufacturer guidance, procurement policy, and field data. Identifies the annual cohort of instruments reaching end-of-life and eligible for replacement.
Tests, procedures, or samples processed per instrument per year - the key driver of consumables and service demand. Low utilization signals untapped capacity; high utilization signals upgrade pressure.
Initial system purchase at point of installation. Highest single-event revenue; driven by new placements and replacement cycles. Applicable: Clinical Diagnostics | Imaging & Radiology | Molecular Diagnostics | Laboratory Automation | Surgical Systems | Life Science Instruments
Recurring revenue from reagents, test kits, cartridges, and disposables consumed per test or procedure. Often the largest and most predictable revenue line over the equipment's lifetime.
Annual service agreements covering preventive maintenance, breakdown repair, and field engineering support. Typically 8–15% of capital equipment value annually.
Connectivity software, laboratory information system integrations, and AI-powered analytics modules. Growing importance in next-generation platform business models.
Indicative revenue split across four streams generated by a typical installed equipment base over its lifecycle
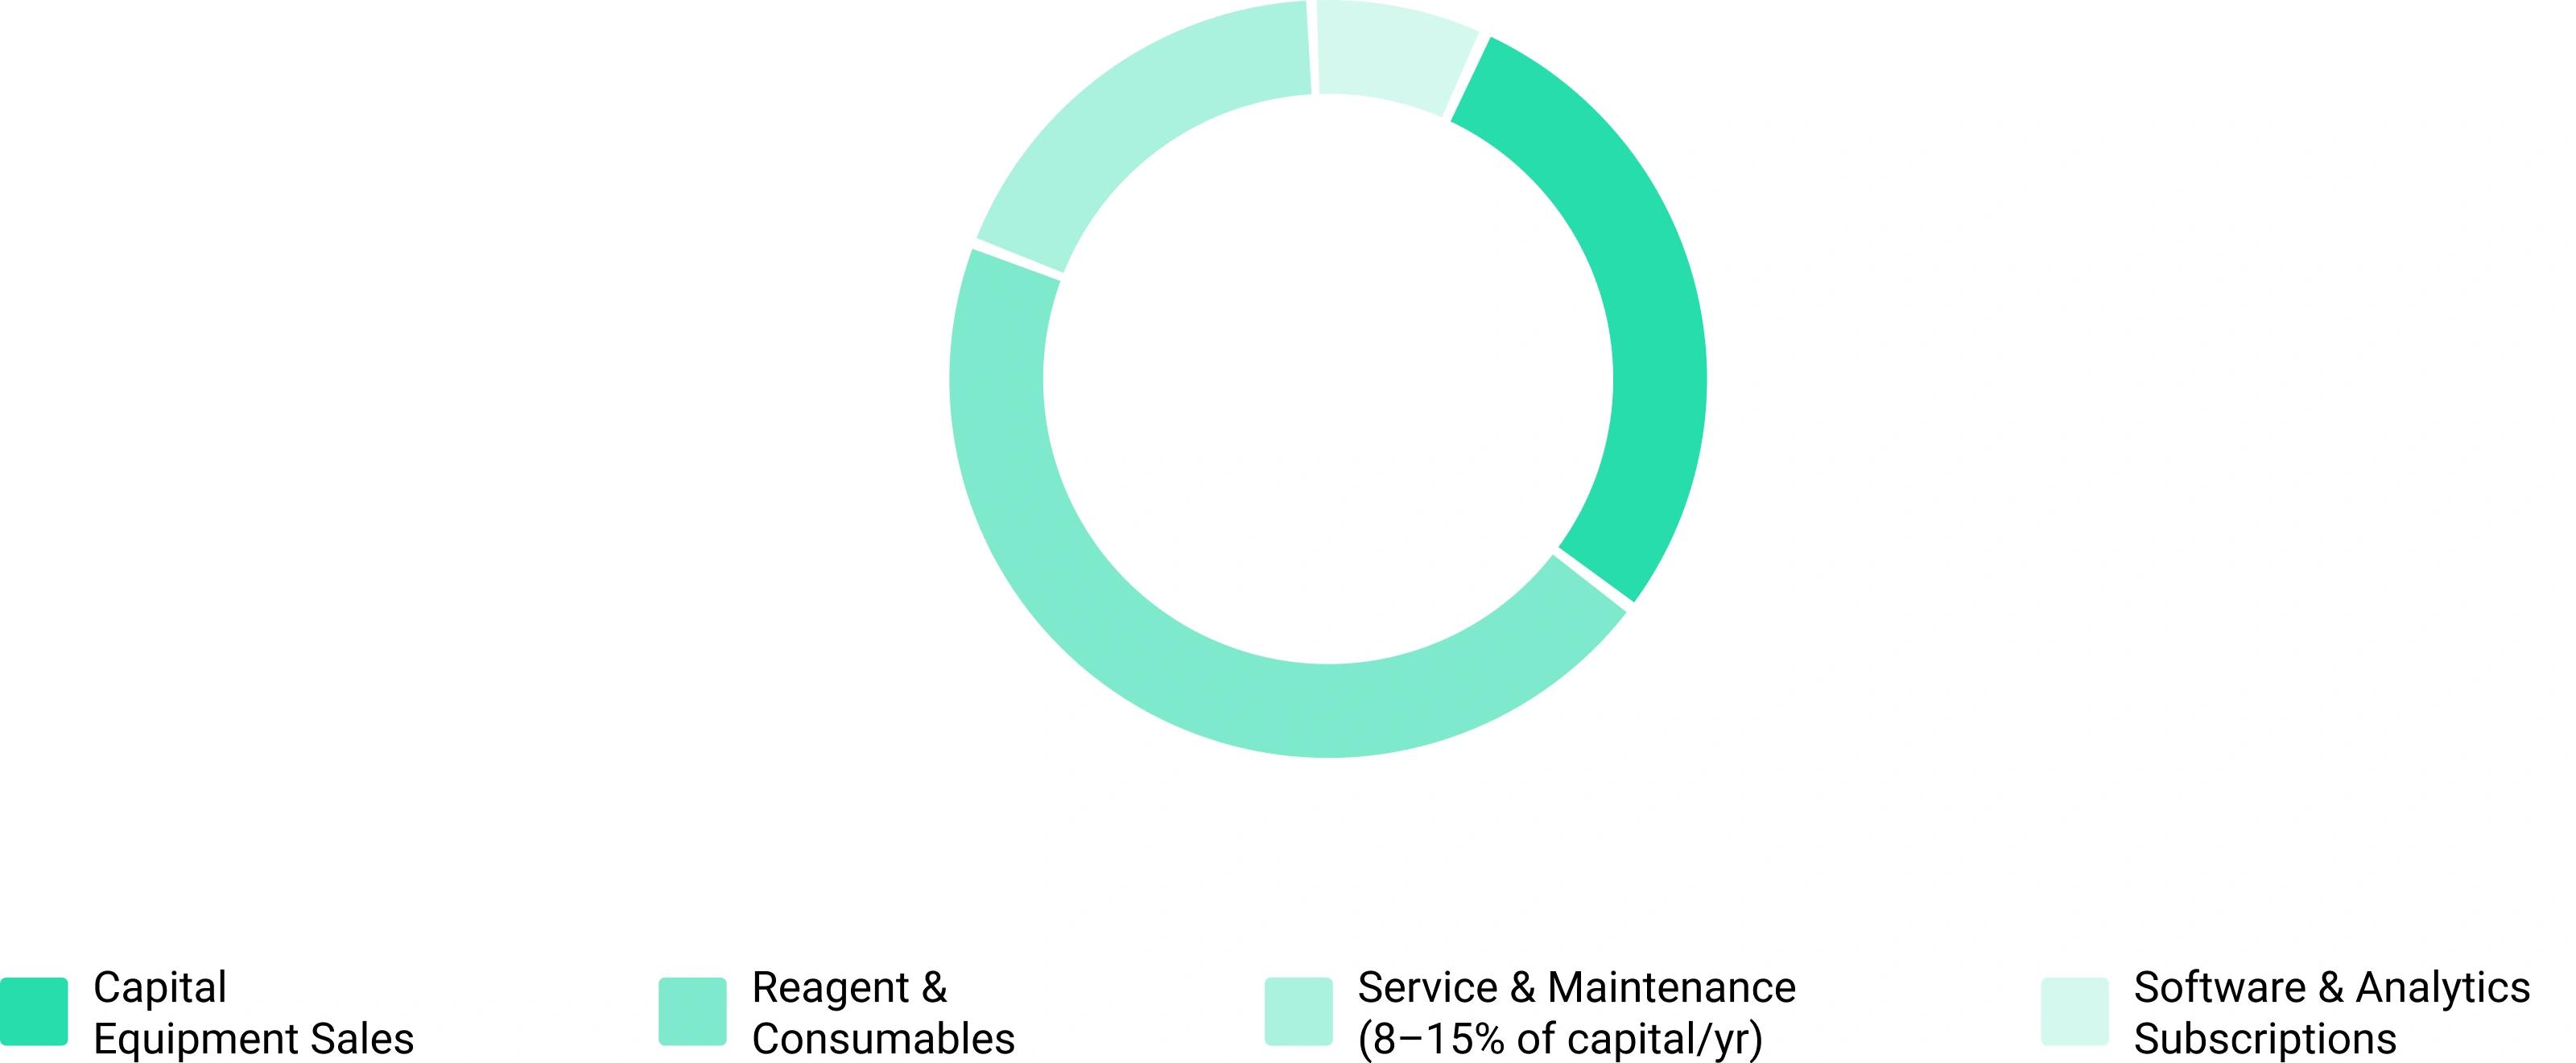
For many healthcare technology markets - particularly in-vitro diagnostics, molecular testing, and life science tools - consumables and reagents represent the majority of total market value, often far exceeding capital equipment revenue. The recurring nature of consumables demand makes this model critical to both market sizing and long-term revenue forecasting.
Consumable usage is modeled as a direct function of test volume per instrument. Consumption rates are calibrated using manufacturer-reported test capacities, clinical protocol data, and laboratory workflow analysis. The model accounts for reagent wastage, calibration runs, and quality control consumption.
In many markets, instruments are placed free-of-charge or at subsidized capital cost in exchange for committed reagent volume. The model captures the economics of these reagent rental arrangements, which fundamentally shift revenue from capital to recurring consumables lines.
Not all installed instruments operate at full reagent utilization. Compliance rates account for instruments in intermittent use, seasonal testing fluctuations, and competitive reagent switching. These adjustments prevent the model from overstating realized consumables demand.
Consumable pricing is subject to competitive pressure, tender-driven price reductions, and volume-based discount agreements. The model forecasts price erosion trajectories by technology maturity stage, with newer platforms commanding premium pricing that compresses as market adoption broadens.
Indicative revenue split across four streams generated by a typical installed equipment base over its lifecycle
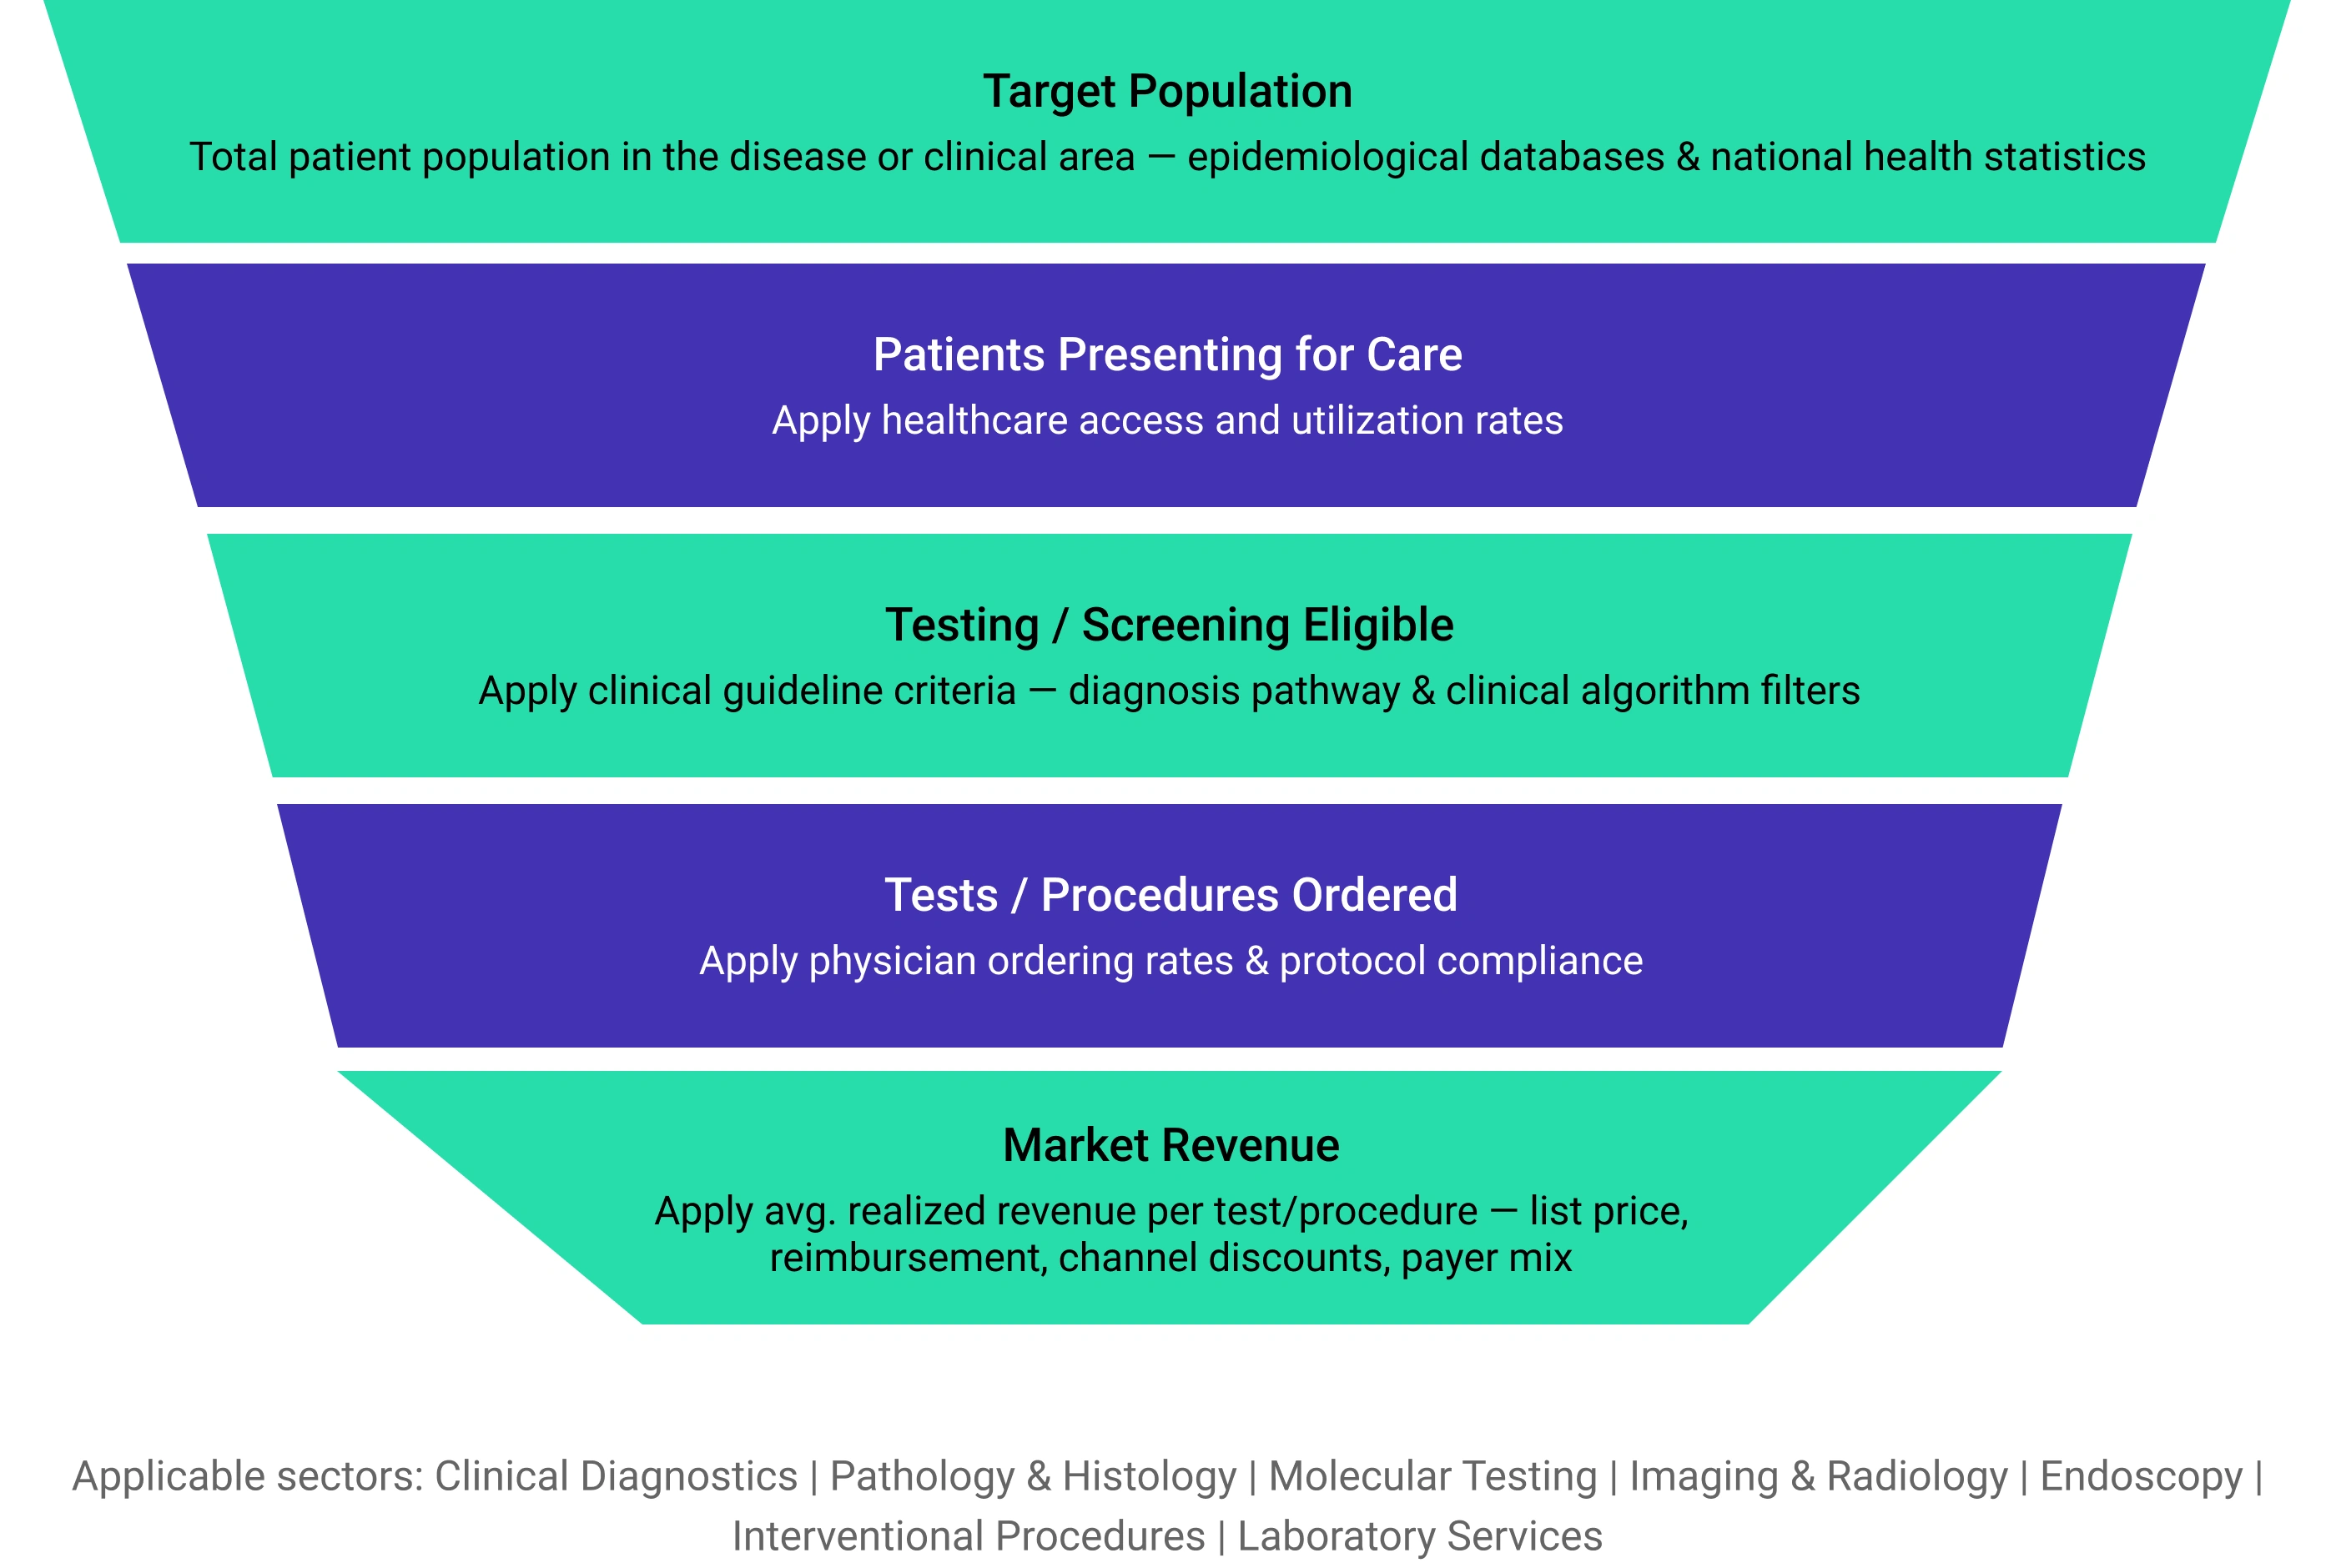
Many healthcare technology segments are fundamentally volume-driven - market size is more accurately estimated from the total number of tests performed or procedures conducted than from equipment counts or facility listings. This methodology starts with patient and disease burden data and progressively filters to the commercially addressable test or procedure volume.
Progressive filtering across 5 stages from total patient population to commercially addressable revenue
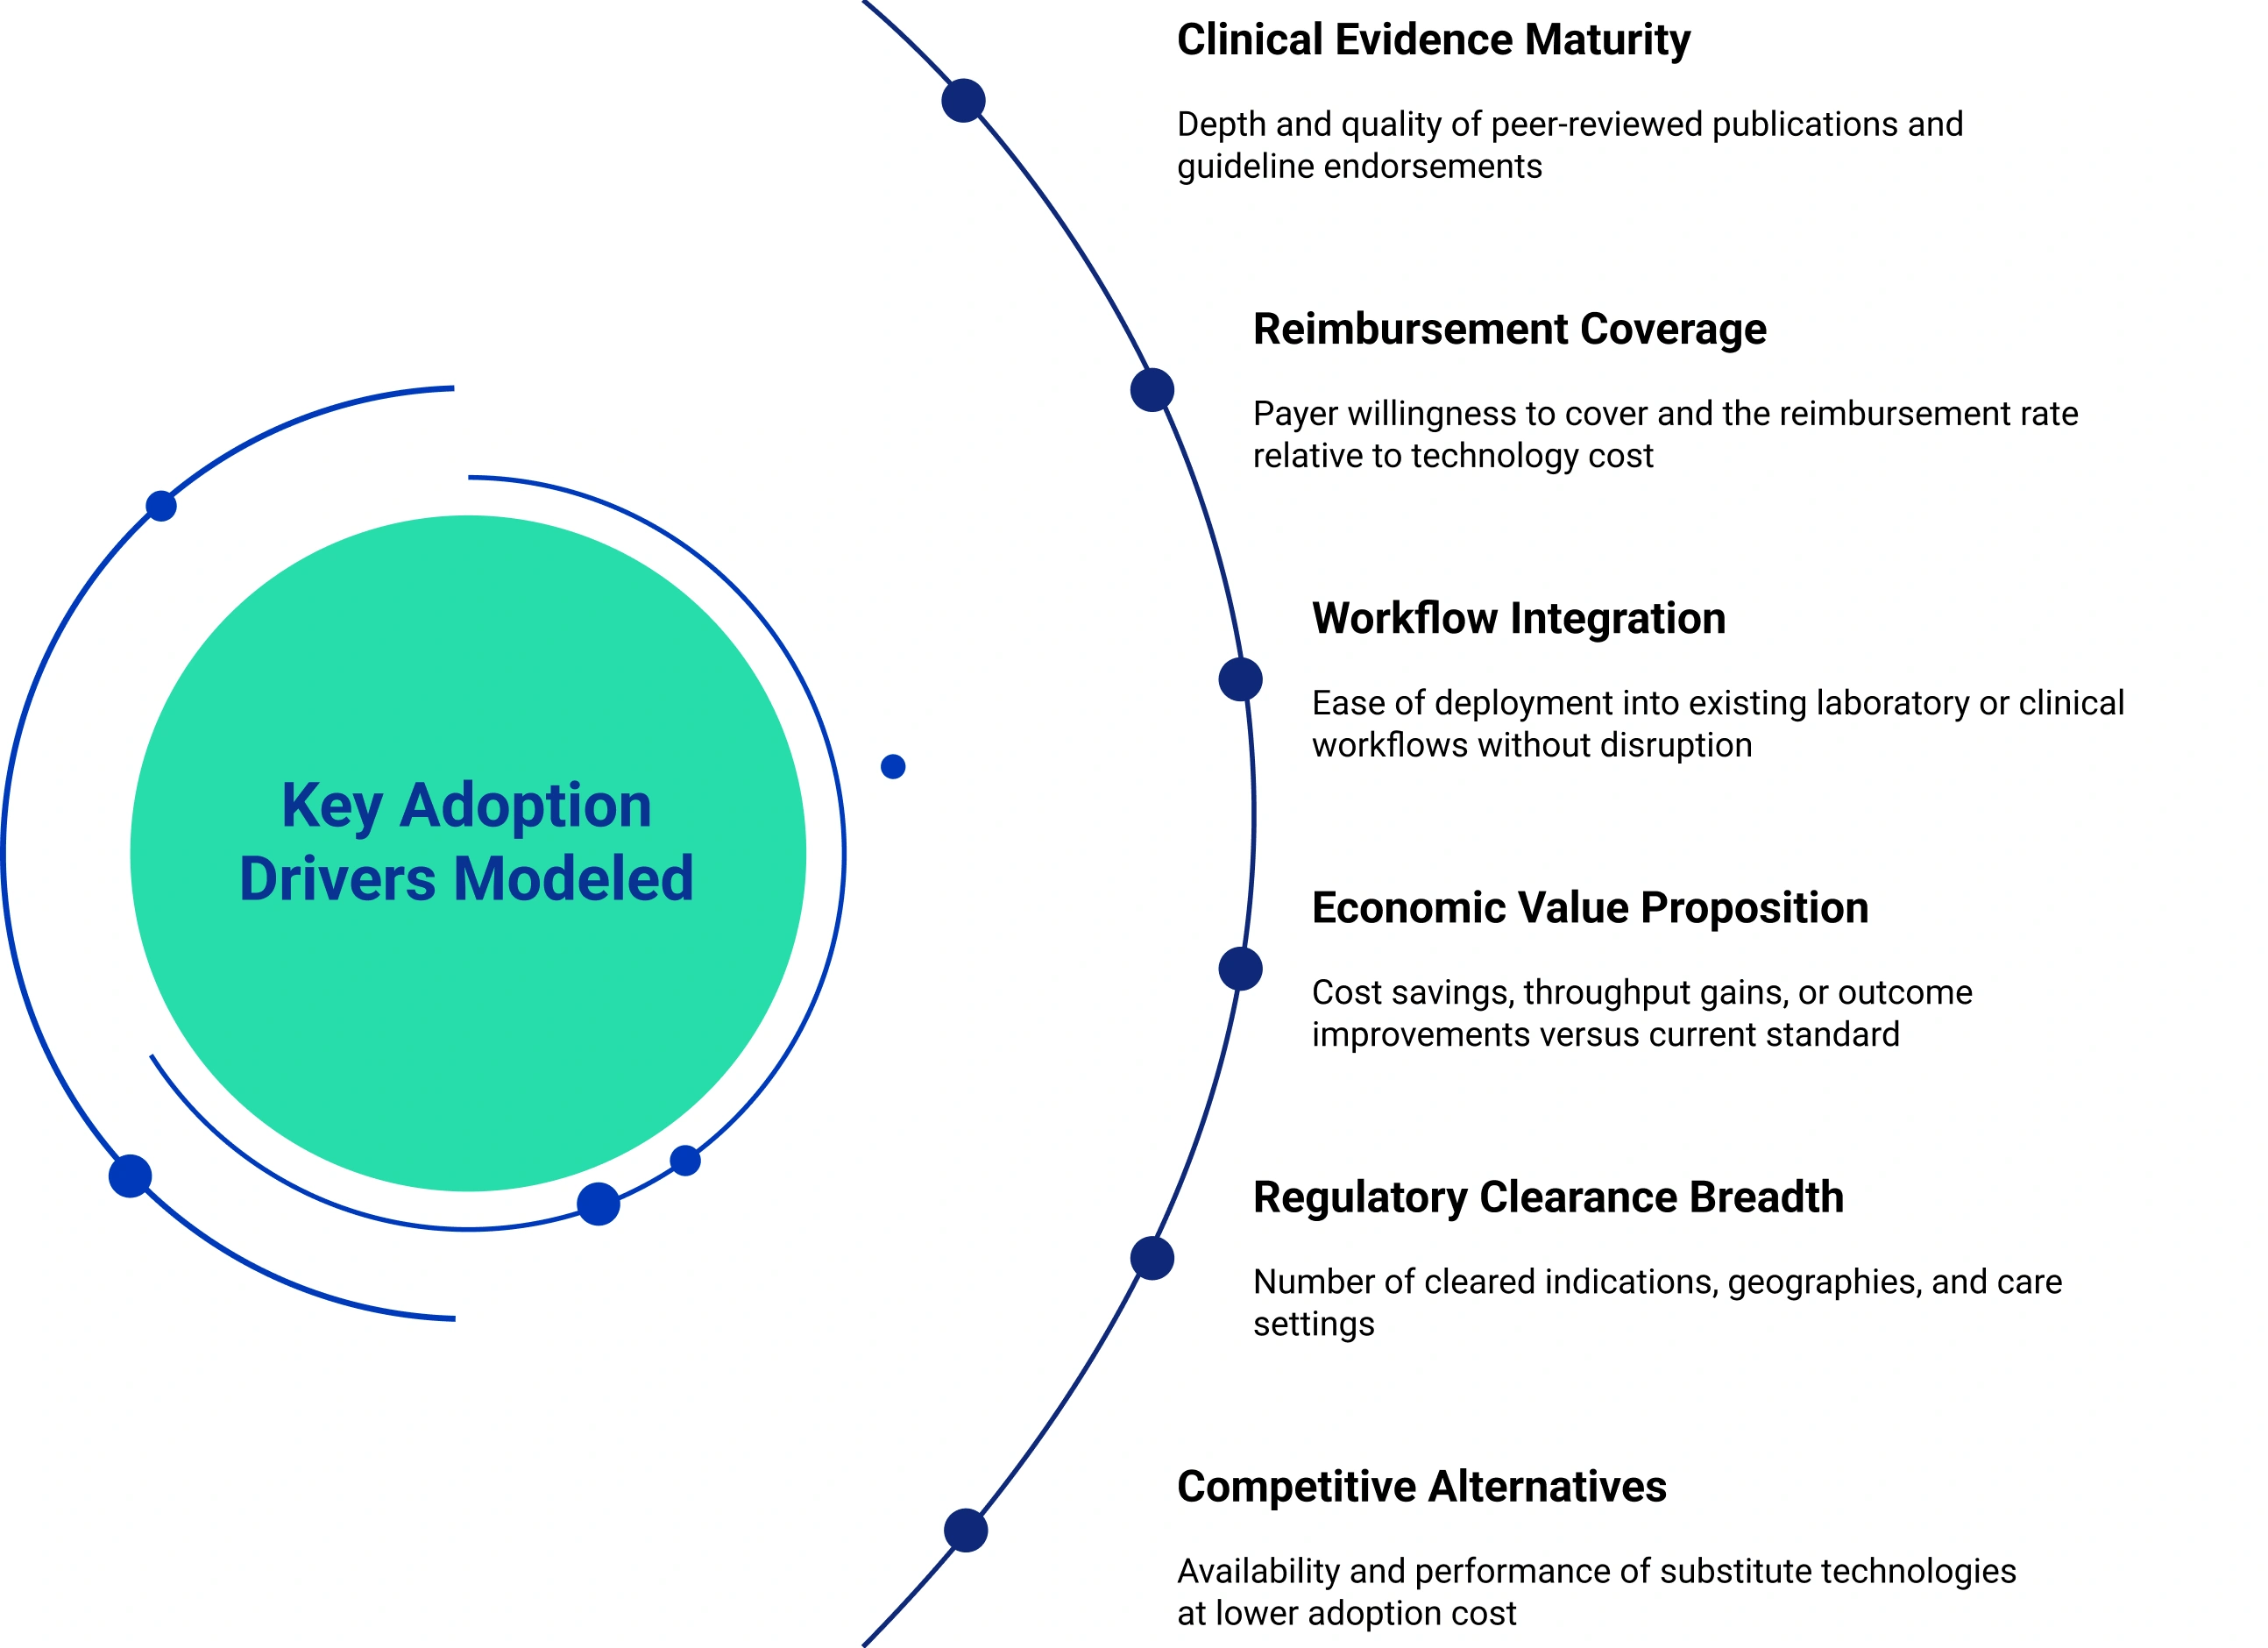
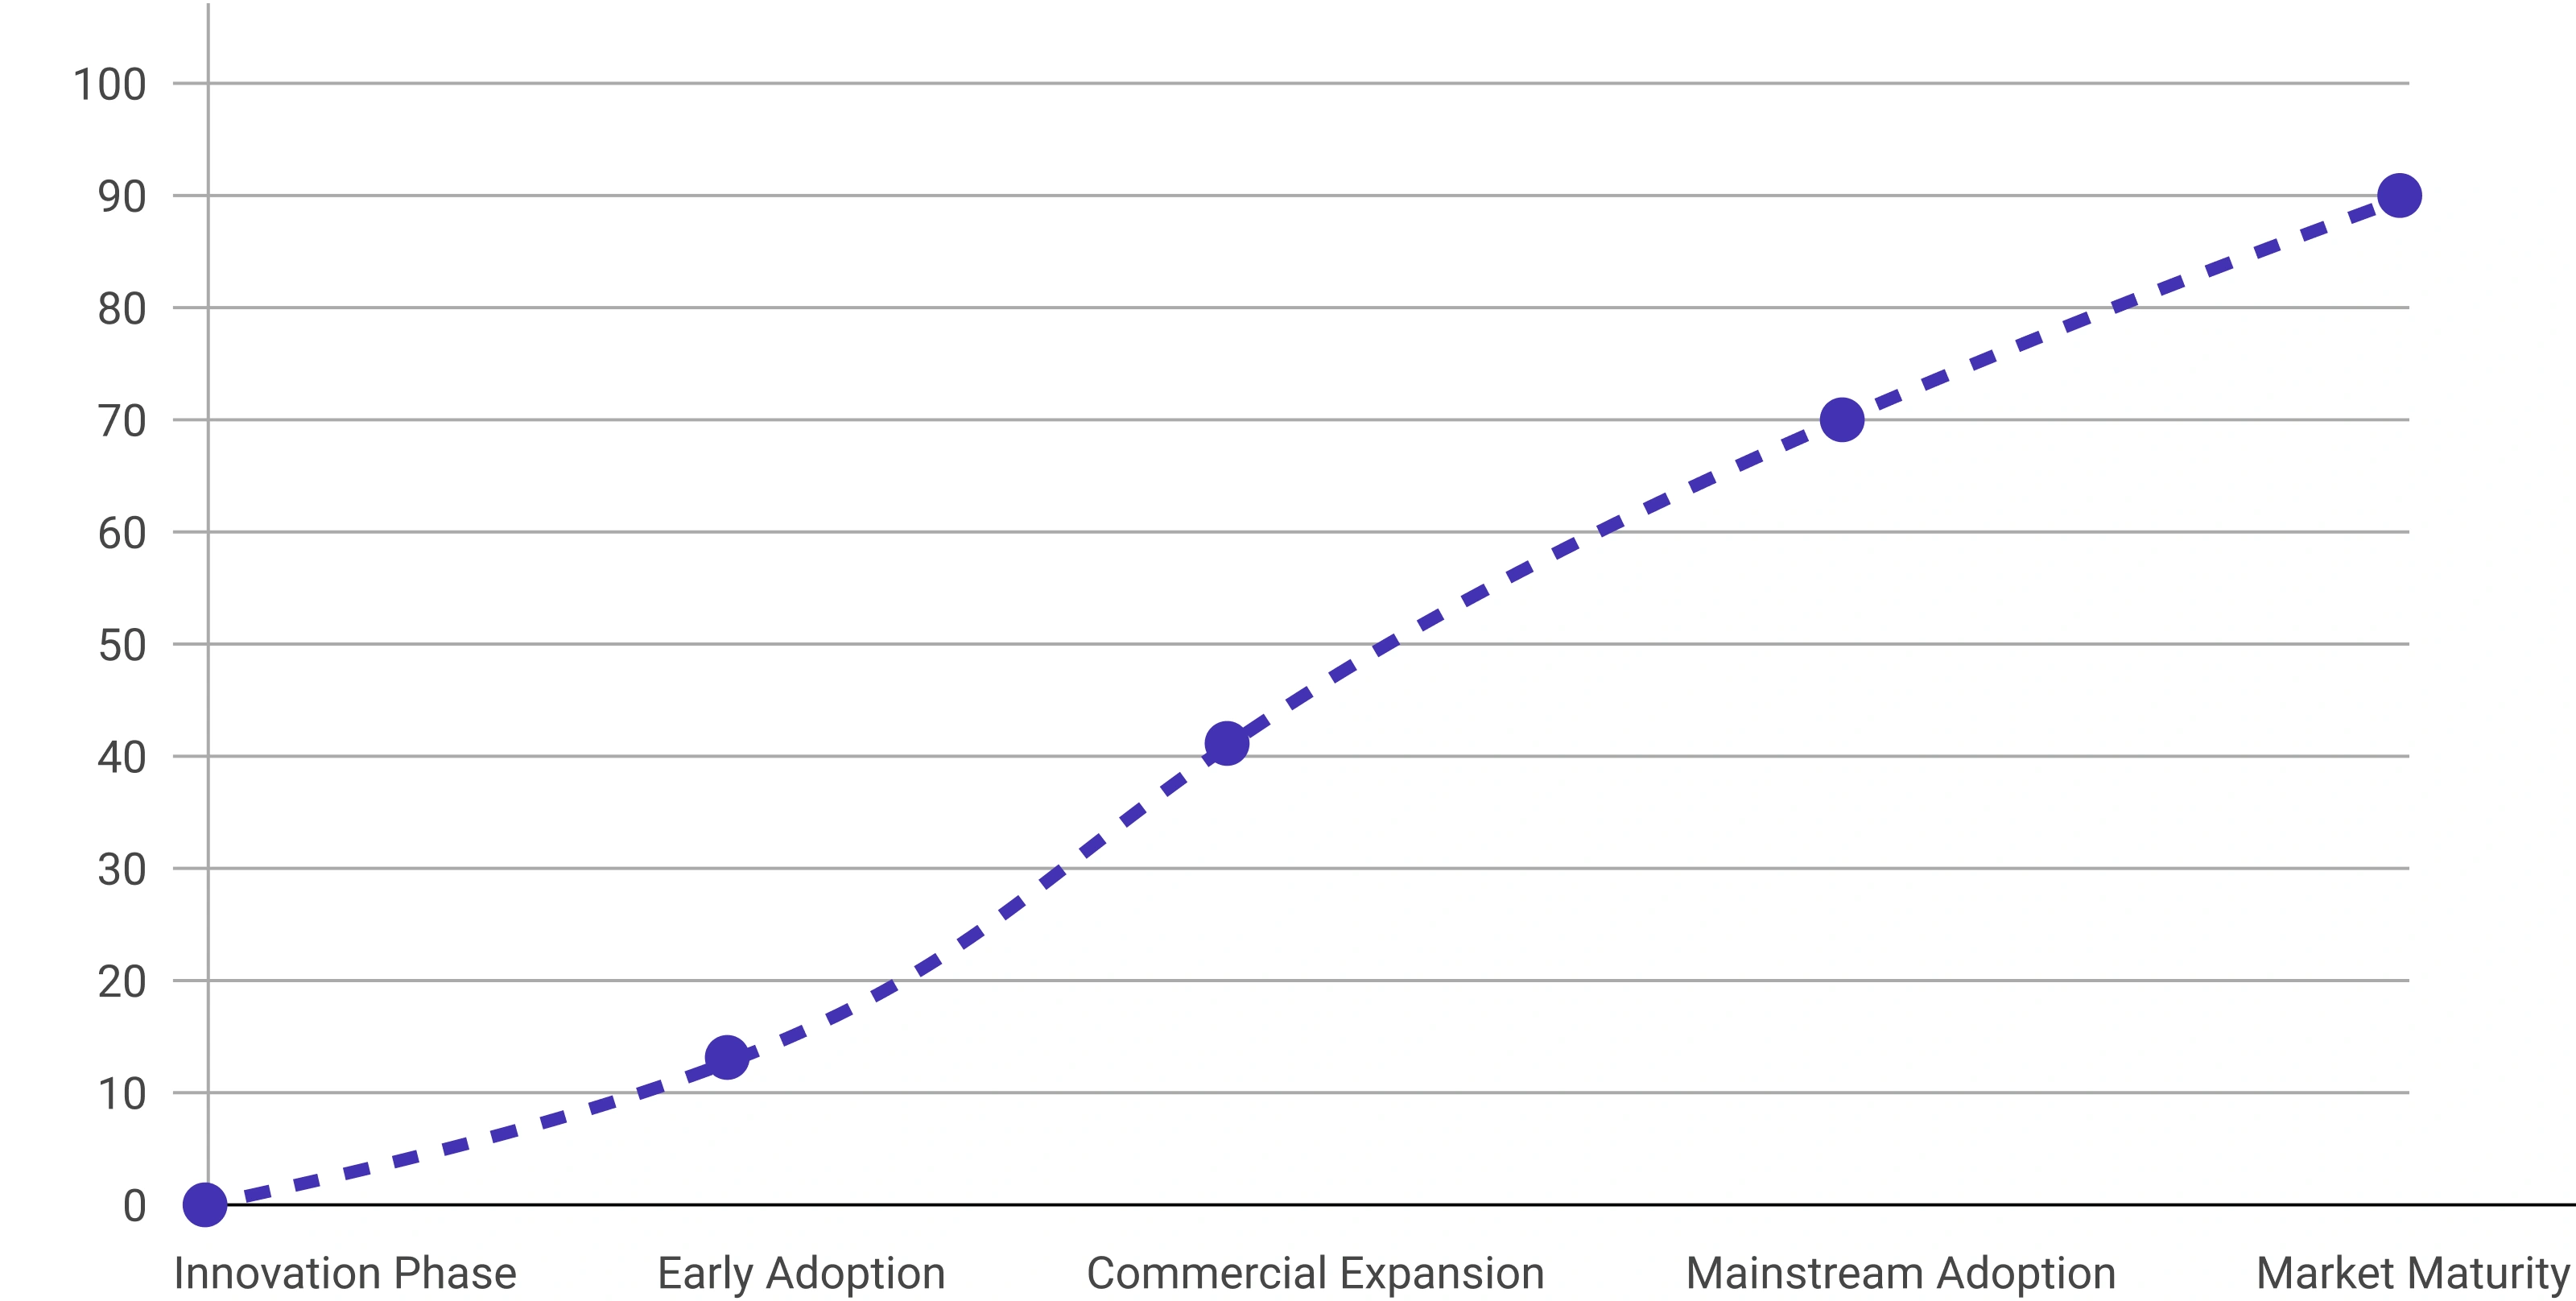
For markets in digital health, AI diagnostics, molecular testing, precision medicine, and next-generation sequencing, the pace of technology adoption is itself the primary market driver. This model estimates market size at each stage of the adoption lifecycle and forecasts the trajectory from innovation to mainstream diffusion - accounting for clinical evidence maturity, reimbursement status, and system-level procurement capacity.
Technology rollout under controlled pilots. Limited market access programs. Revenue from R&D partnerships and grant-funded pilots.
Opinion leaders and innovative health systems procure. Clinical evidence accumulates. Reimbursement codes under development.
Broad institutional procurement begins. Reimbursement established. Vendor competition increases. Price pressure emerges.
Standard of care in leading markets. High volume, competitive pricing, growth driven by geographic and segment expansion.
Replacement-cycle driven. Incremental innovation sustains moderate growth. Consolidation among platform providers.
Illustrative indexed revenue growth across the five adoption stages for a healthcare technology platform
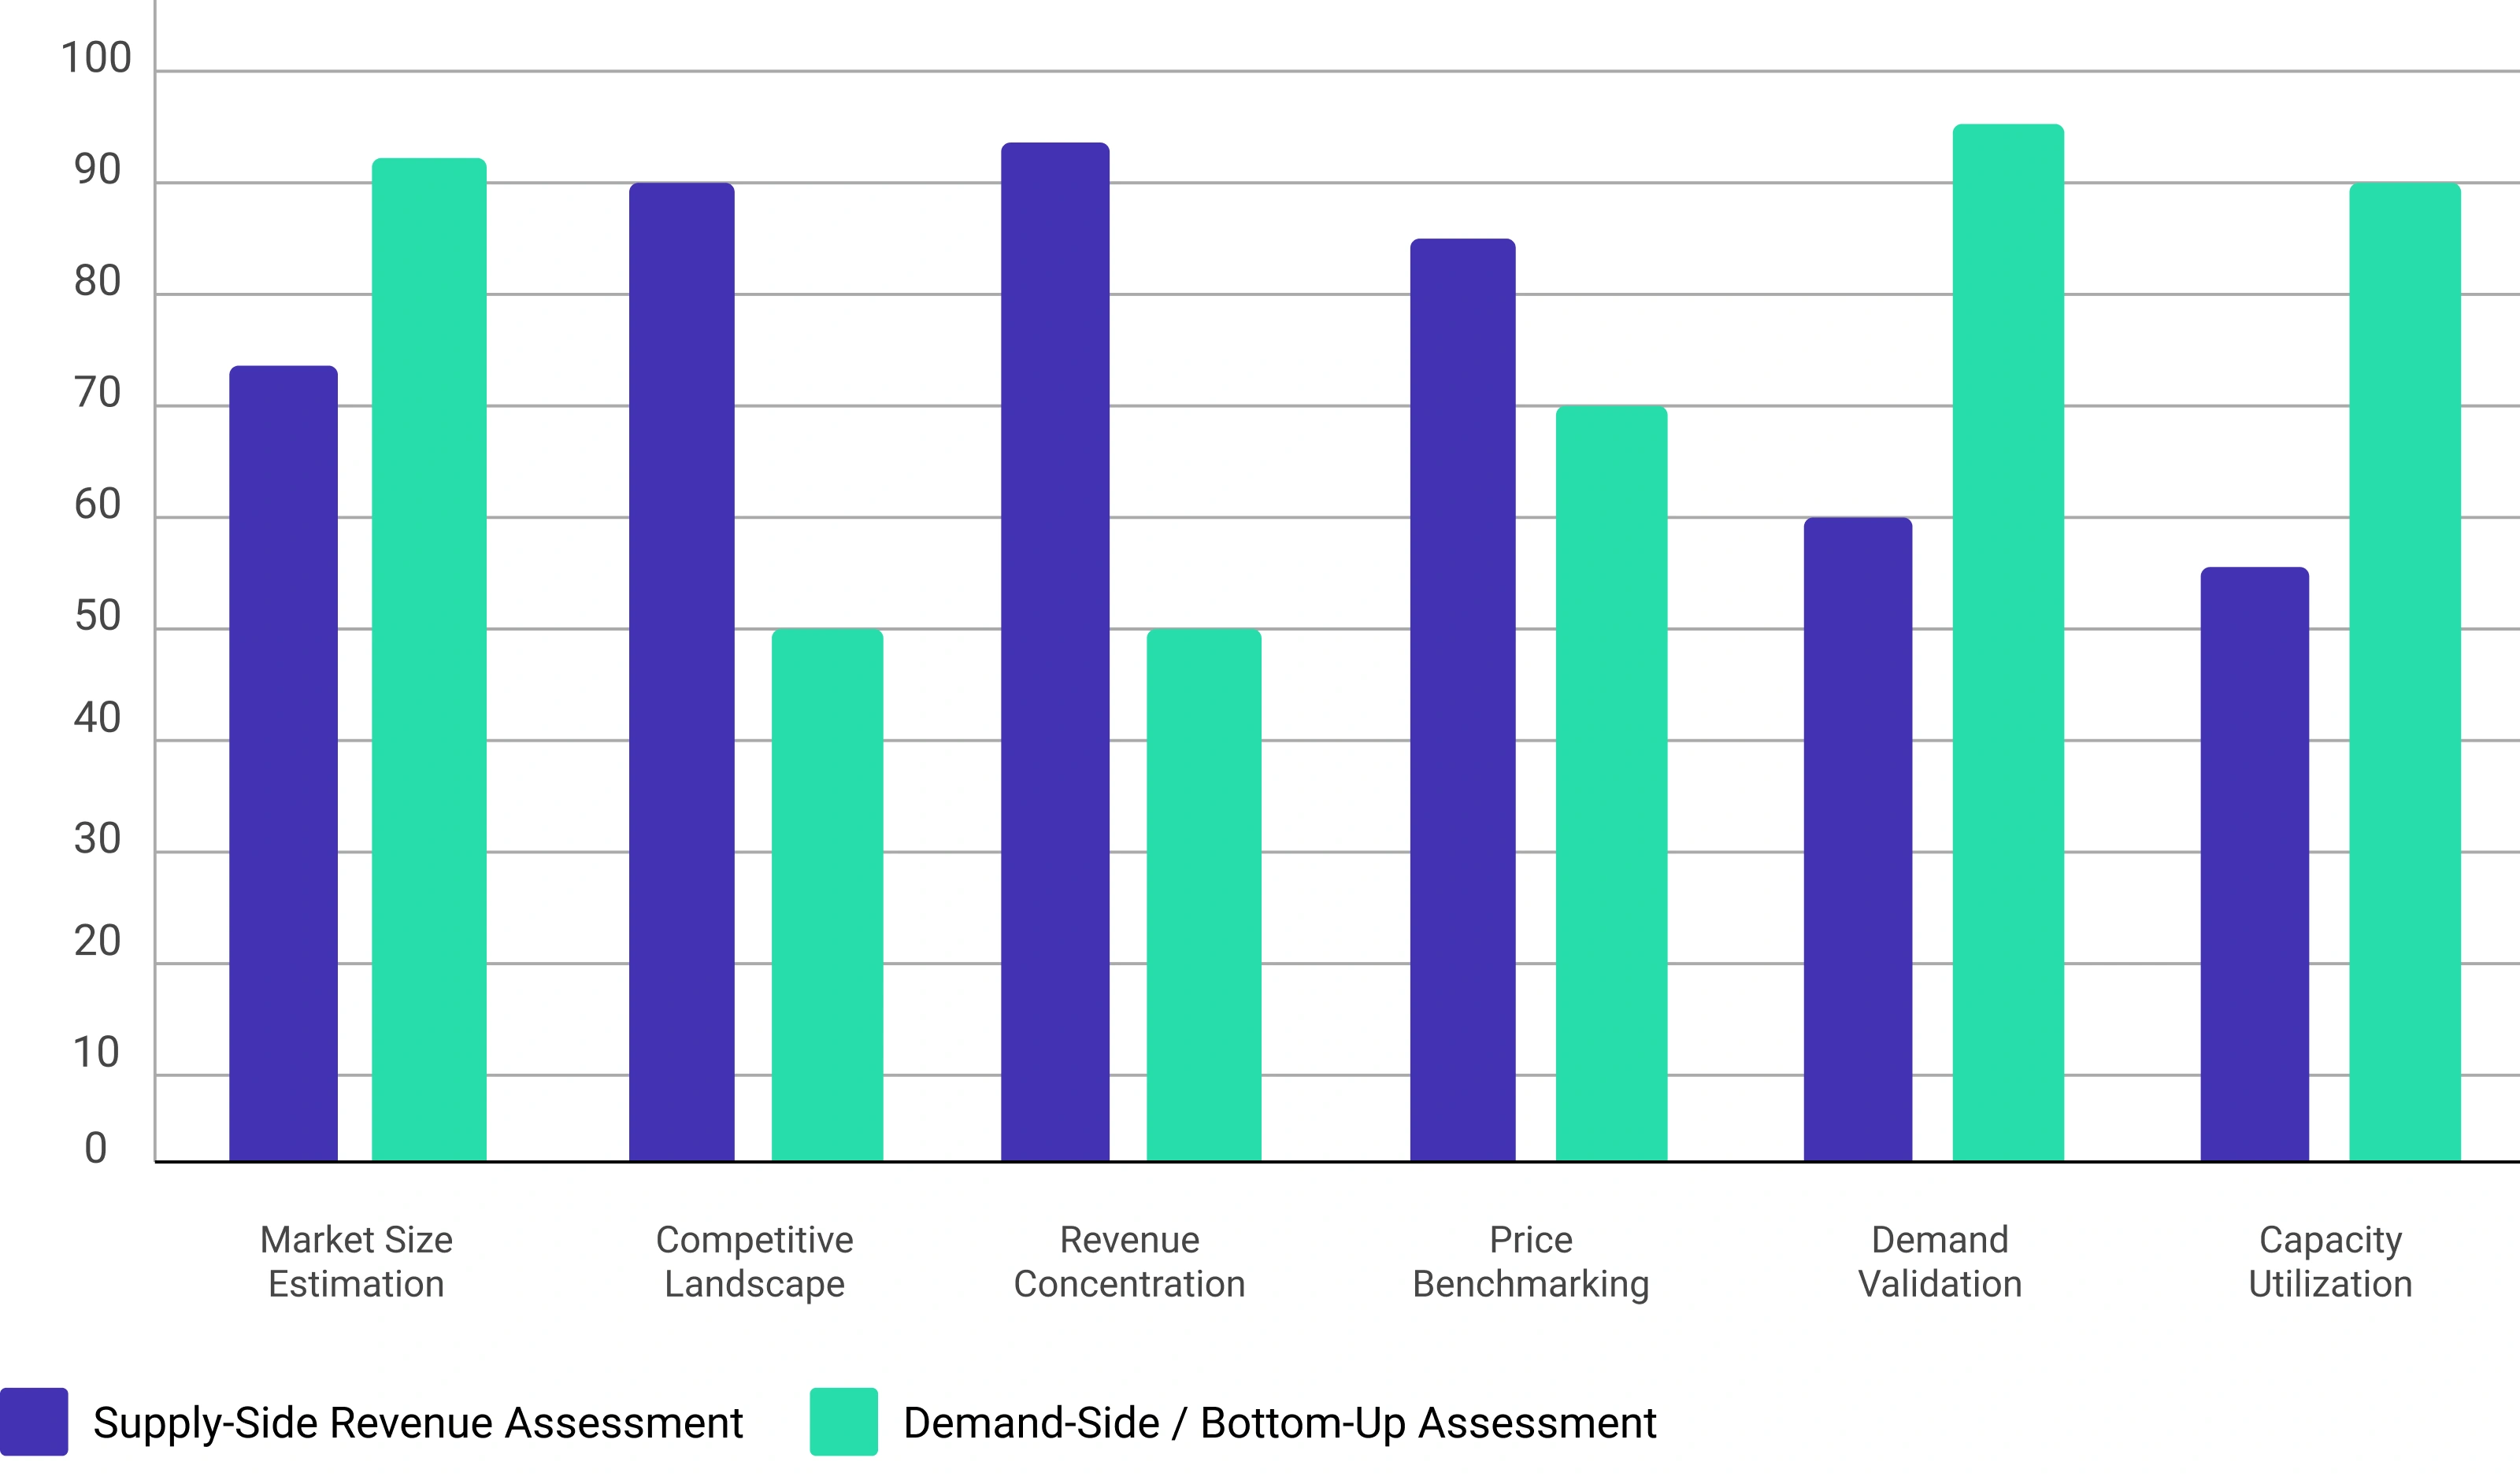
Supply-side analysis estimates total healthcare technology market size by aggregating revenues generated by device manufacturers, diagnostics companies, laboratory service providers, software vendors, and technology distributors operating in the space. Revenue inputs are drawn from publicly filed financial statements, investor presentations, earnings call disclosures, and segment-level reporting. Where direct product-level data is unavailable, revenues are estimated through portfolio contribution analysis, regional revenue allocation, and product category share modeling. This methodology does not operate as a standalone sizing approach - it is applied as a critical triangulation layer, validating demand-side estimates and identifying market concentration dynamics that influence commercial strategy. Revenue components captured include: capital equipment sales, reagent and consumables revenue, service and maintenance contracts, software licensing, and diagnostic service fees.
Healthcare infrastructure routinely operates below its theoretical maximum capacity. Understanding actual utilization rates is critical to distinguishing between installed capacity and the commercially addressable market - a distinction that bottom-up models built on facility counts alone often fail to capture. Capacity utilization modeling evaluates laboratory throughput against nominal capacity, equipment runtime against available hours, and sample volumes against stated processing limits. It incorporates staffing levels, shift patterns, supply chain constraints, and quality control overhead. Low utilization identifies markets where volume growth is the primary opportunity. High utilization signals the need for additional equipment placements or capacity expansion investment. In both cases, the utilization model ensures that market estimates reflect achievable demand rather than theoretical ceiling.
Relative contribution of each approach across six analytical dimensions
Healthcare industry markets are analytically complex. No single methodology captures the full range of demand drivers. Our triangulation framework develops each sizing approach independently and formally reconciles the outputs - minimizing systematic bias and producing final estimates that are robust against variability in any single input assumption.
Independent review and consistency check of each methodology
Investigation of significant variances between model outputs
Targeted primary research or source review to resolve discrepancies
Final estimates published only when all methodologies demonstrate reasonable alignment
Relative weight each sizing input contributes to the final reconciled market estimate
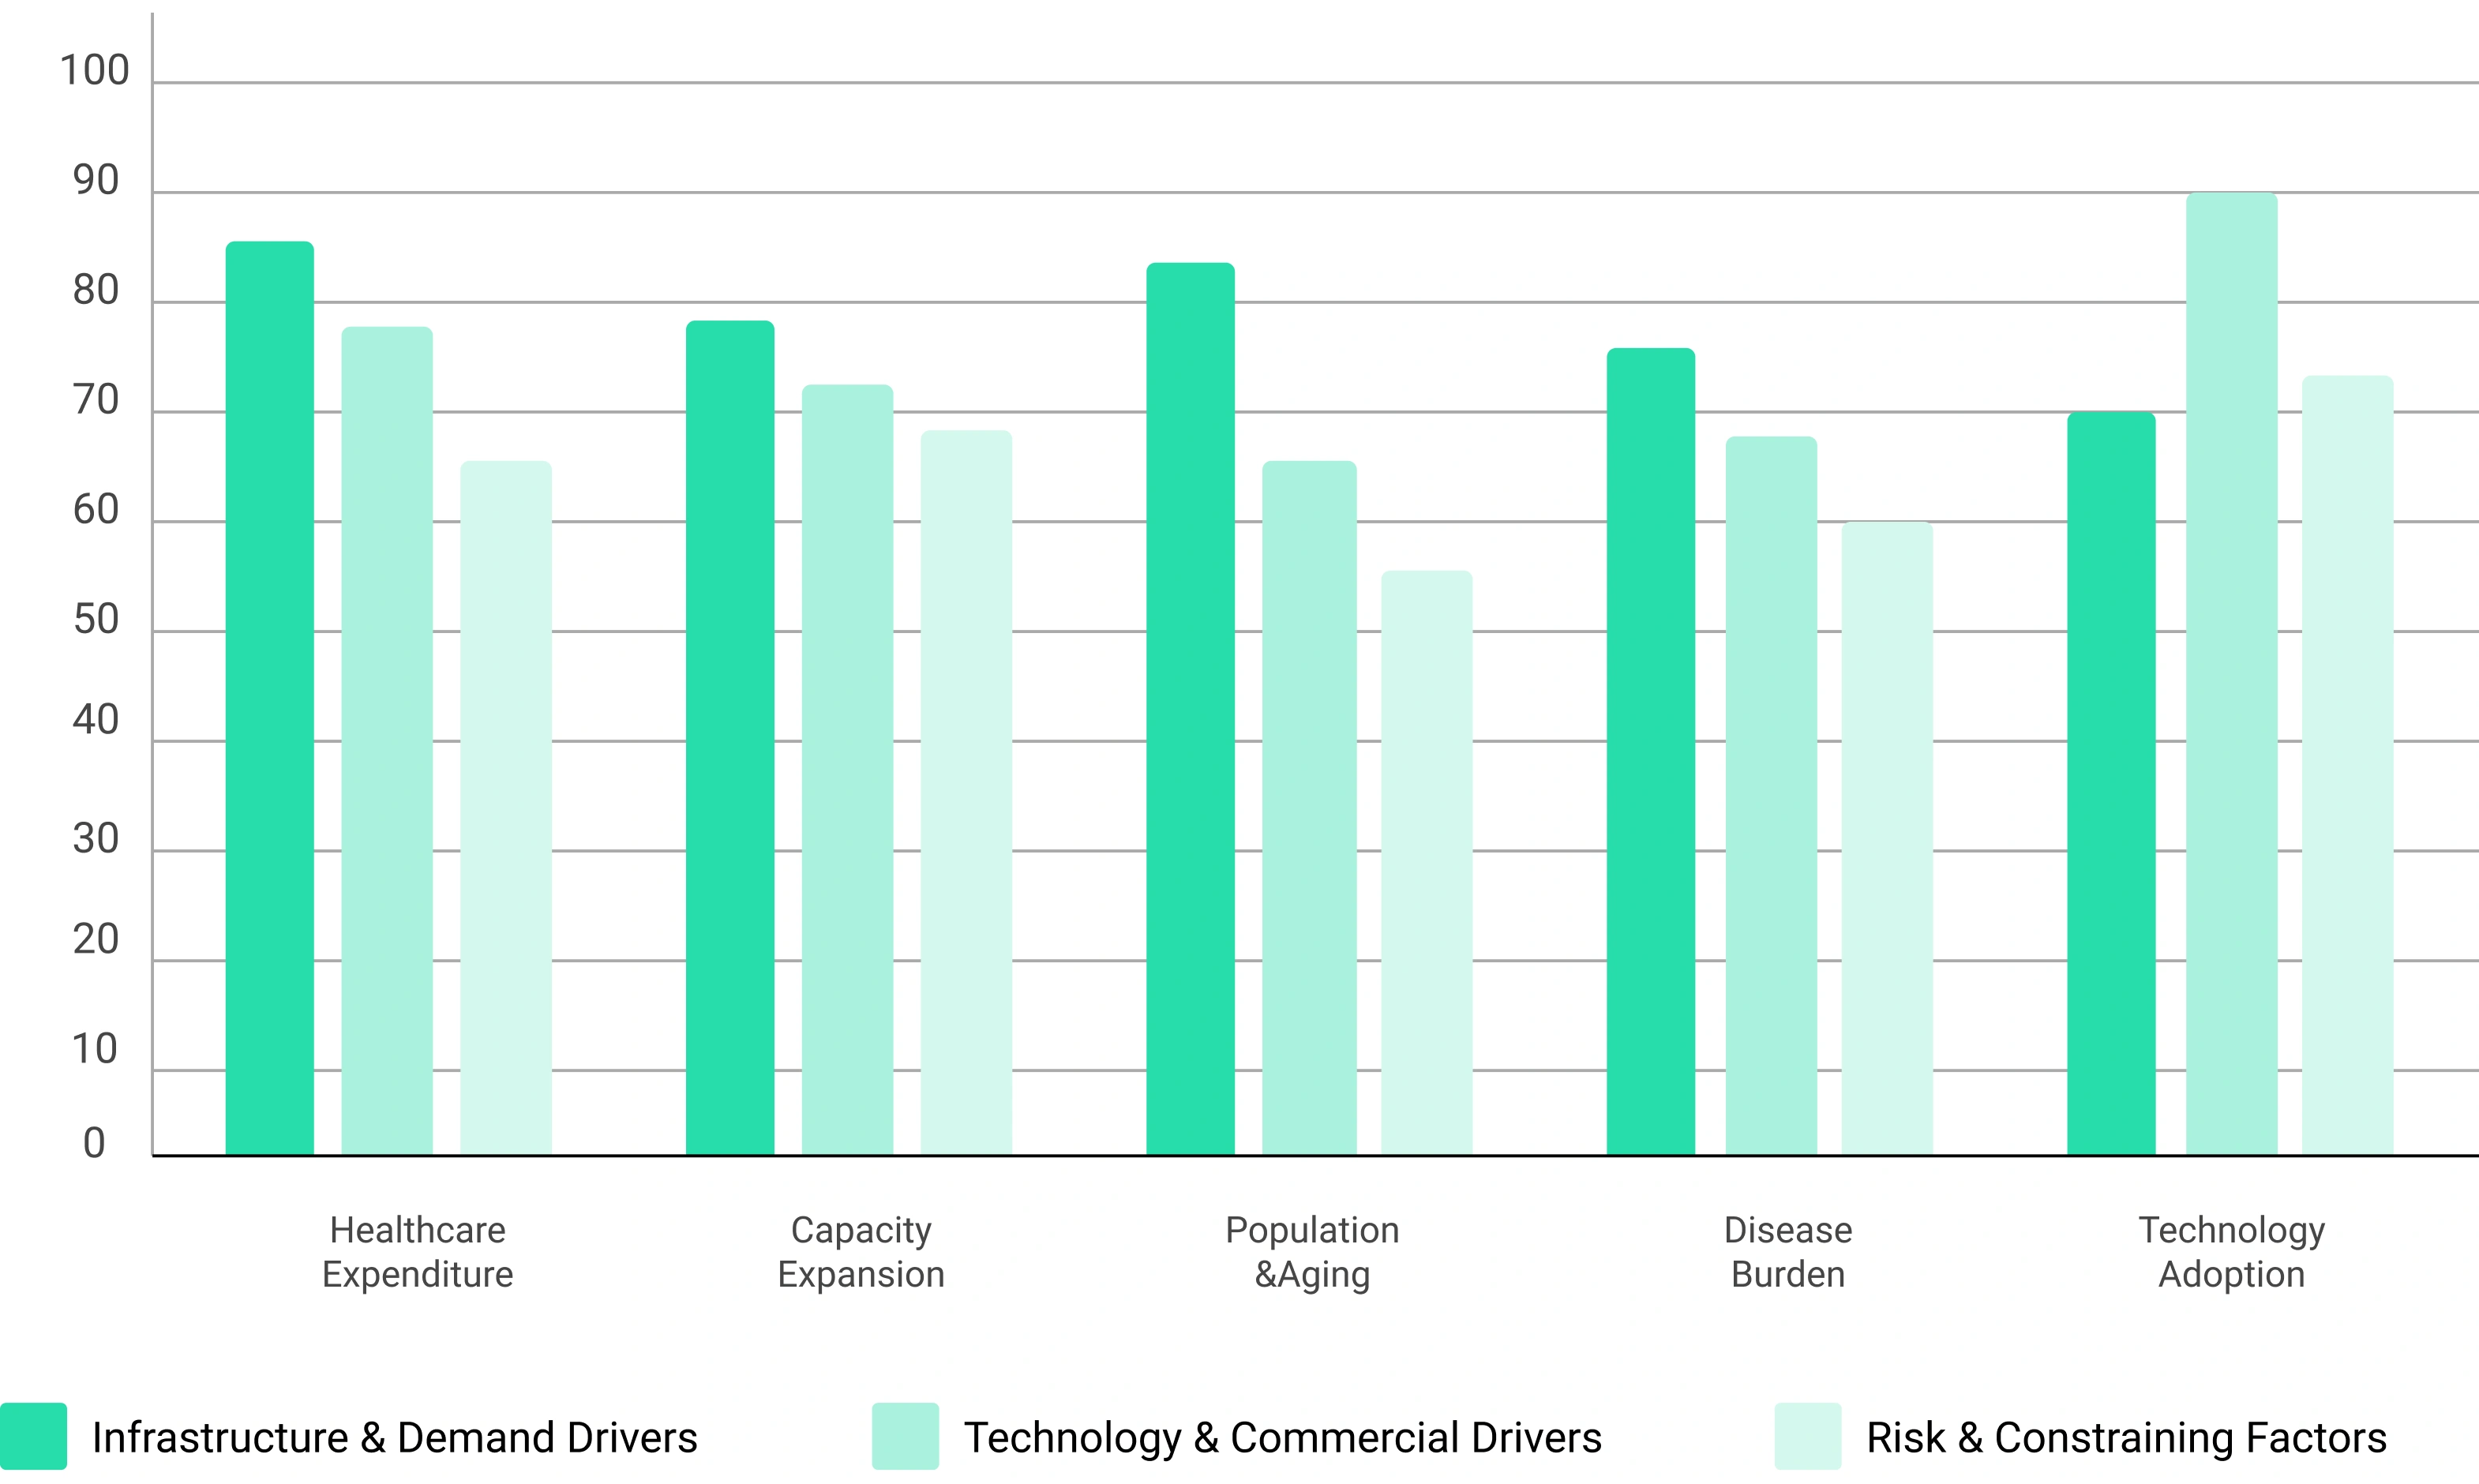
Healthcare technology forecasting models future market evolution through the combined impact of independently projected growth variables. Rather than applying a fixed growth rate, each driver is assessed individually - capturing the distinct contribution of infrastructure investment, technology innovation, population dynamics, and adoption acceleration. These are integrated into a composite model that generates a structured forecast with transparent, auditable assumptions.
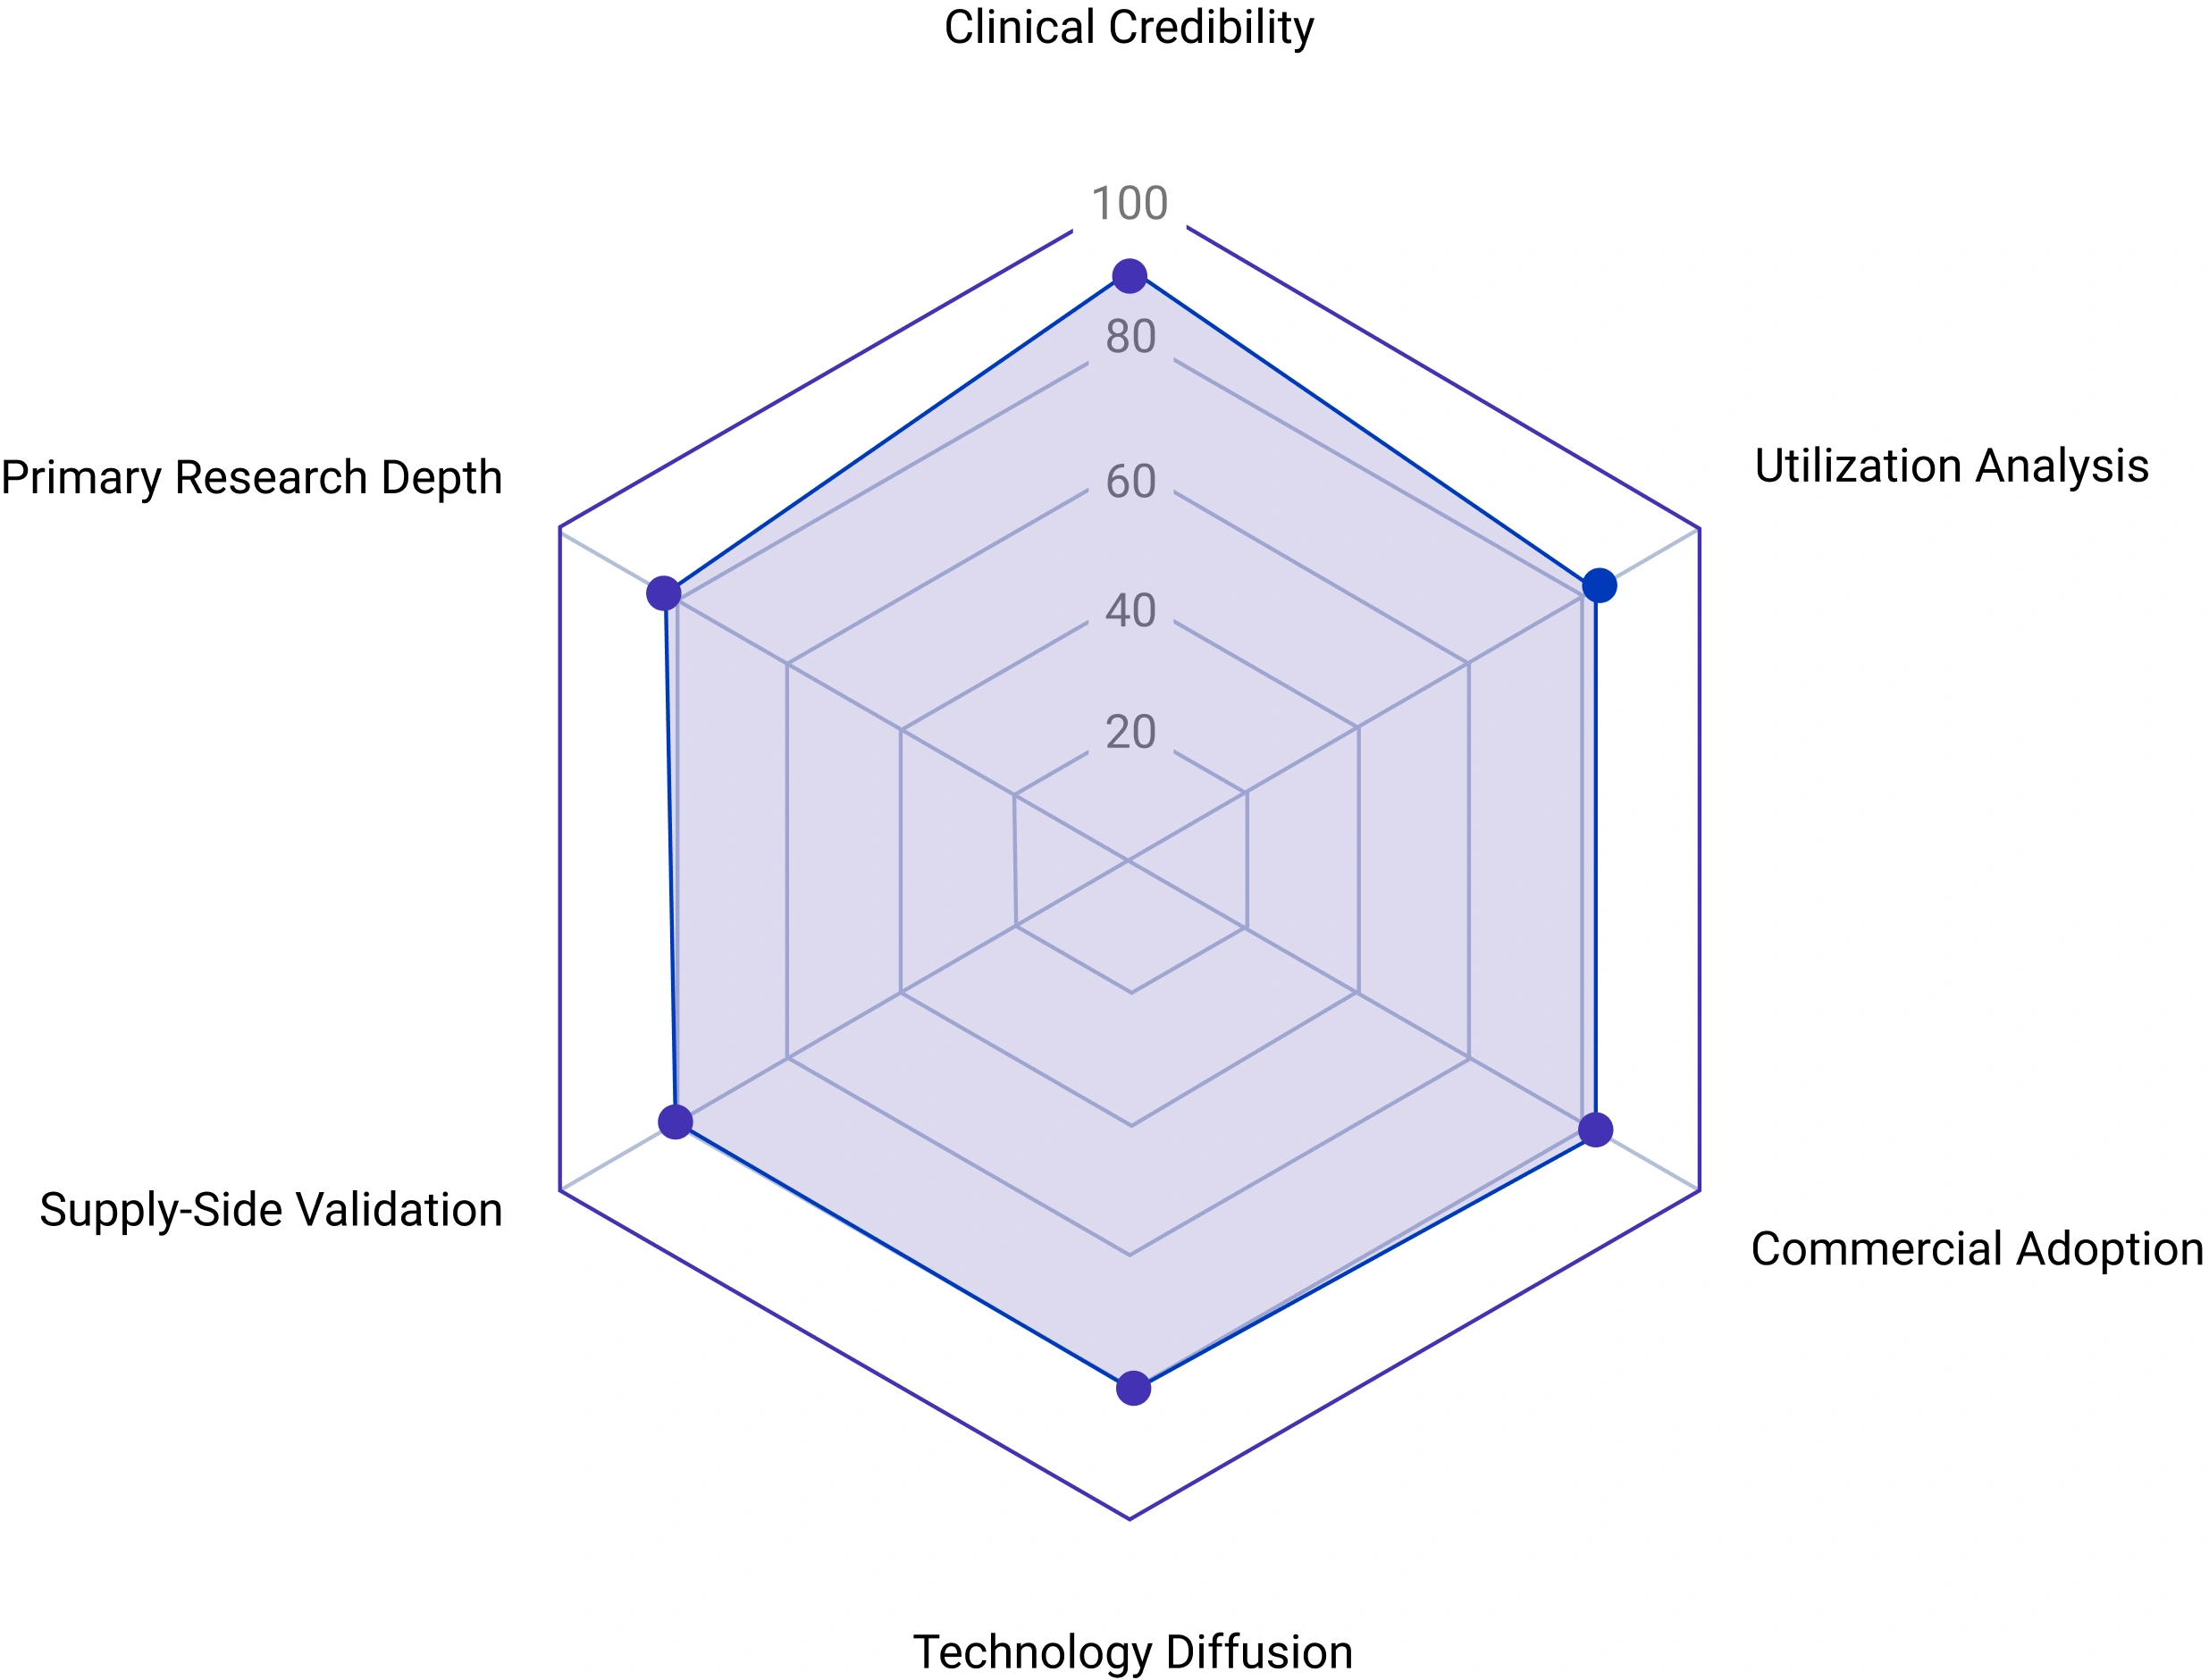
Relative impact score (0–100) of each driver on healthcare technology market forecast
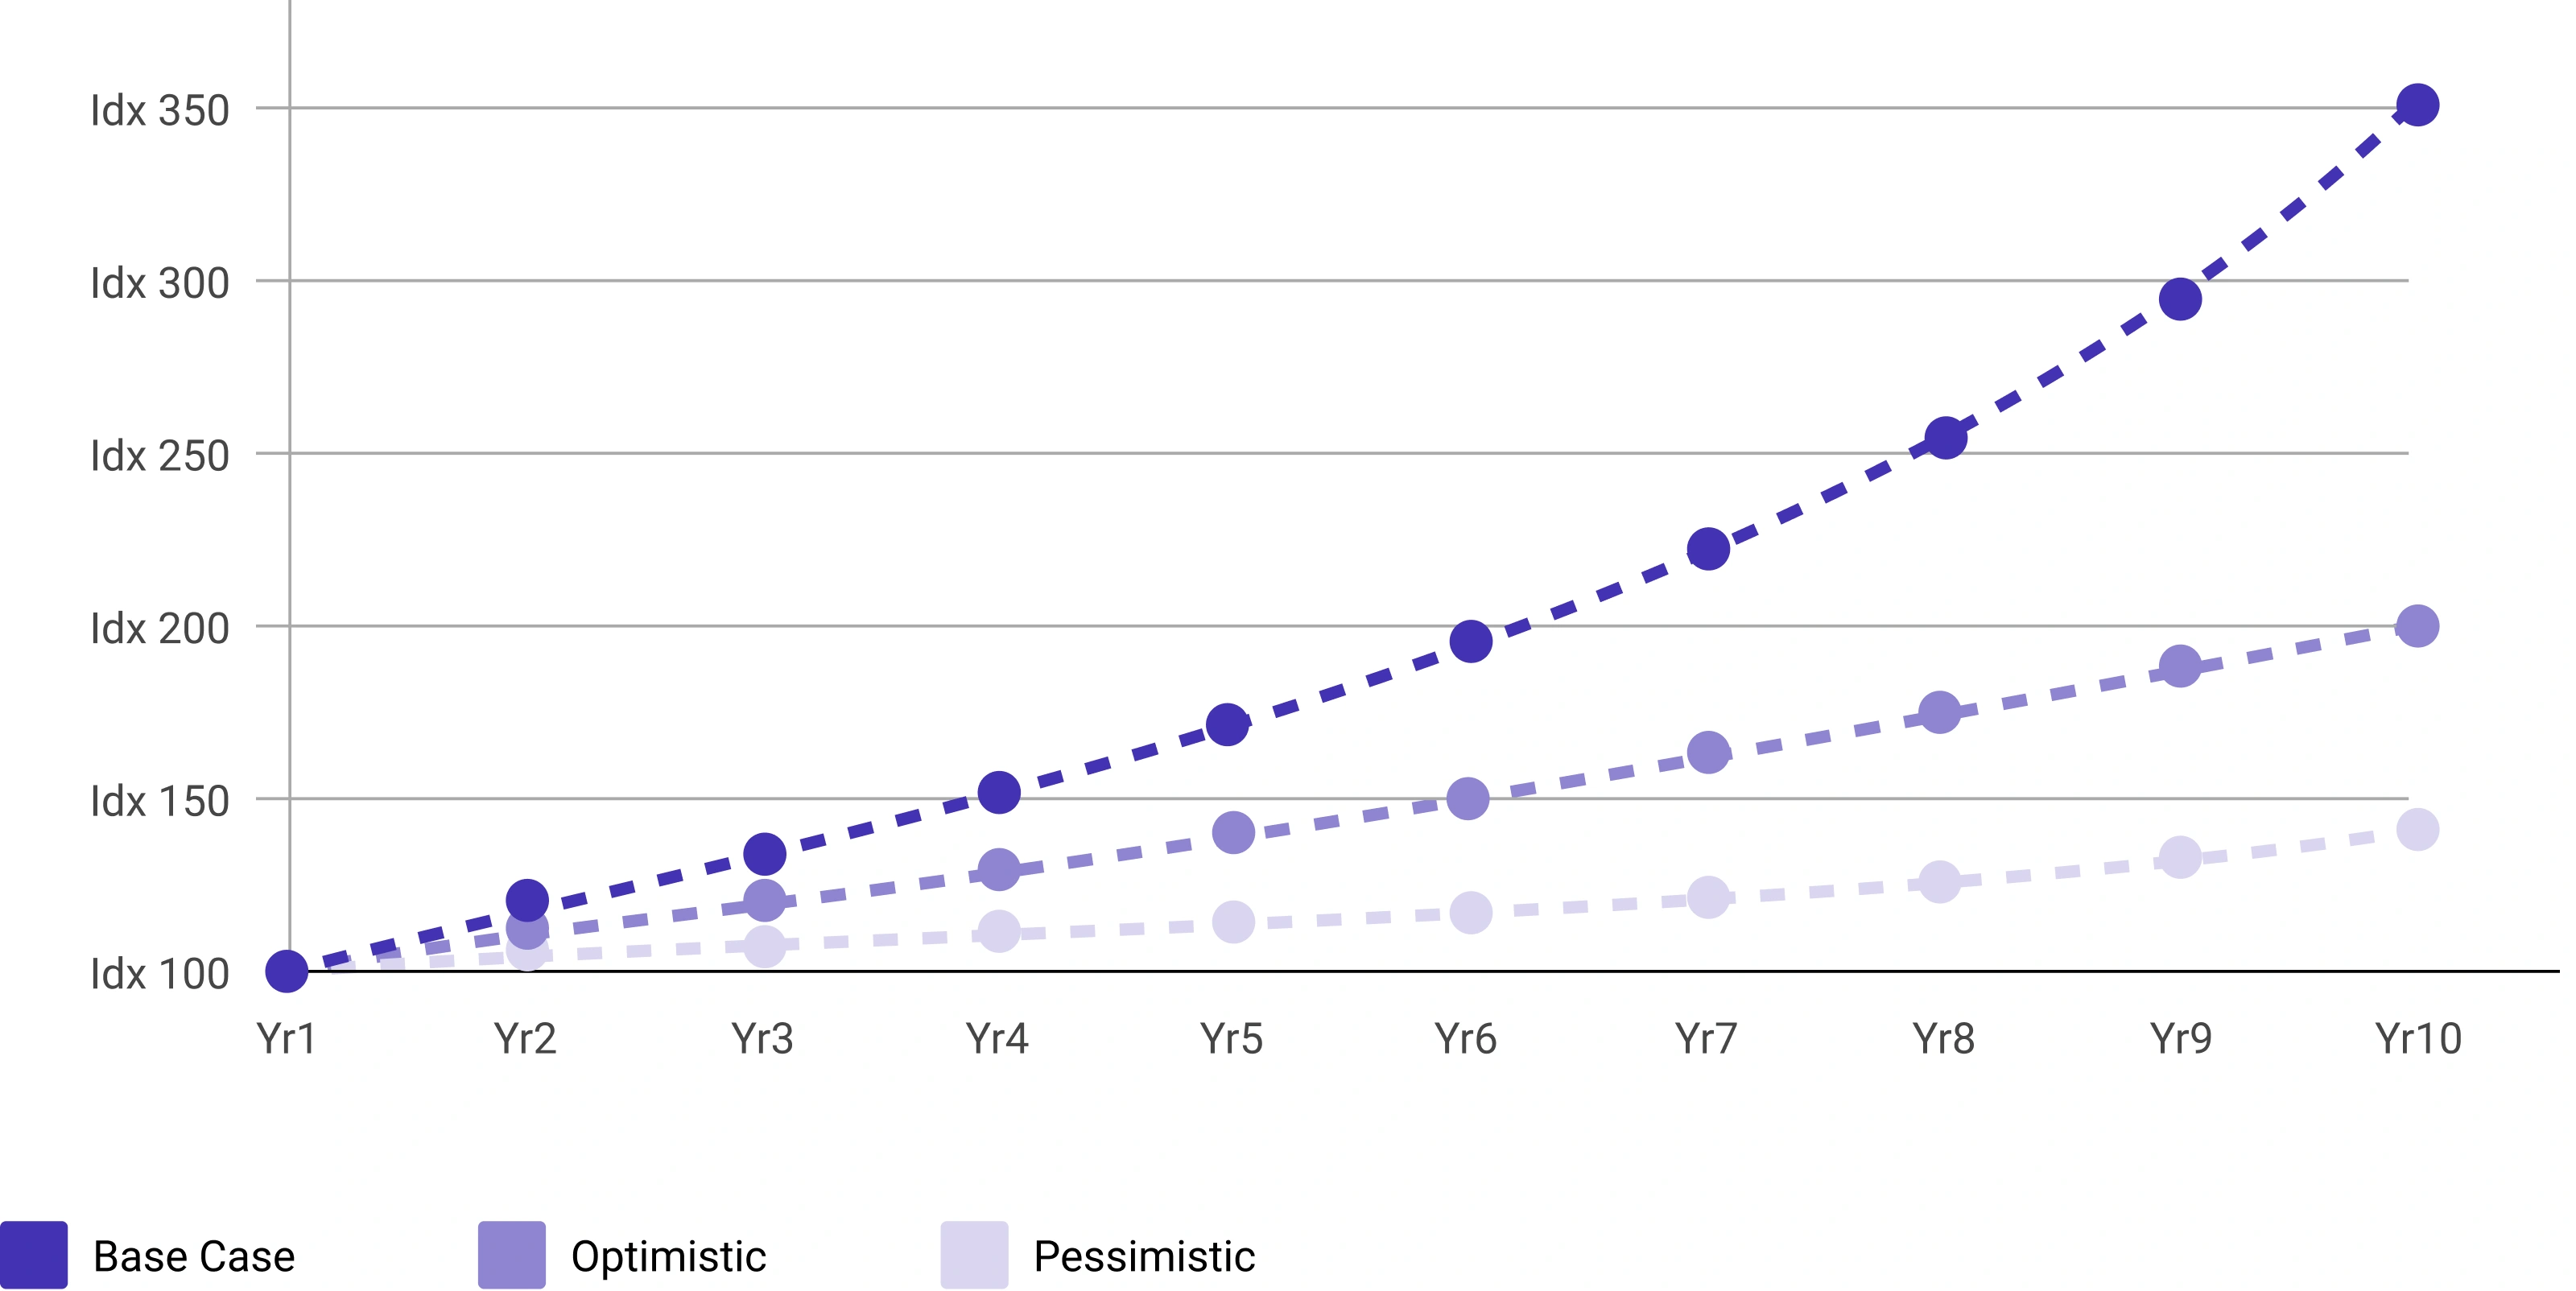
Scenario analysis quantifies the range of potential outcomes and helps stakeholders understand the boundaries of forecast uncertainty. Each scenario is built around a coherent set of assumptions about healthcare investment levels, technology adoption pace, regulatory progress, and competitive dynamics.
Constructed from current evidence and expected market developments. Assumes healthcare spending continues along historical growth trajectories, technology adoption proceeds at historically observed rates, regulatory approvals follow standard timelines, and procurement cycles operate within normal institutional constraints. This scenario forms the primary reference point for strategic planning, resource allocation, and investment decisions. It reflects neither exceptional opportunity nor exceptional constraint.
Models conditions under which growth exceeds the base case. Assumes faster-than-expected technology adoption driven by strong clinical evidence or regulatory support, increased healthcare capital investment, expanded reimbursement coverage, accelerated laboratory automation programs, and higher-than-expected demand from emerging markets. Also used to stress-test commercial upside - examining whether the addressable opportunity is large enough to justify investment at the optimistic edge.
Quantifies downside risk by modeling conditions under which market growth is below expectation. Assumes budget constraints delay capital equipment procurement, regulatory approvals face extended timelines, reimbursement rates are reduced, adoption is slowed by workflow integration challenges, and competition from substitute technologies intensifies. Essential for risk planning - ensuring that go-to-market decisions and investment return expectations account for materially adverse market outcomes.
Illustrative indexed growth trajectories across Base, Optimistic, and Pessimistic scenarios over a 10-year forecast horizon
Vf = Final Value|Vi = Initial Value|n = Years
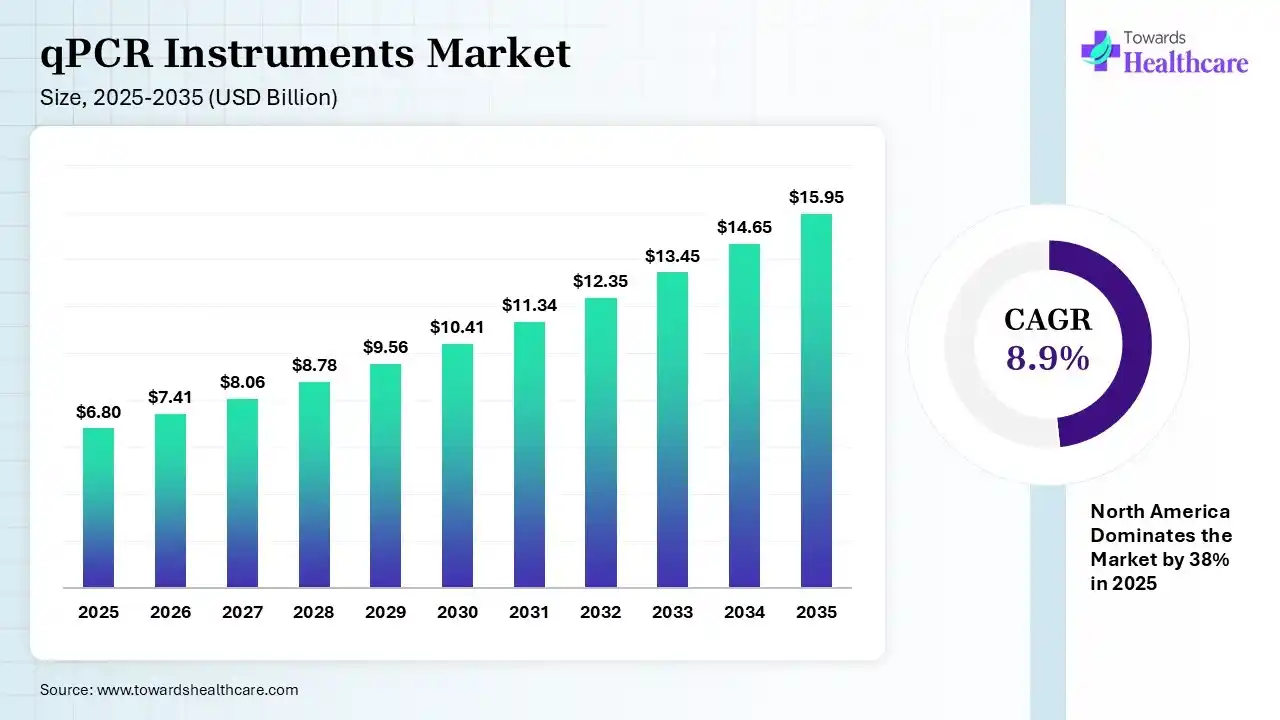
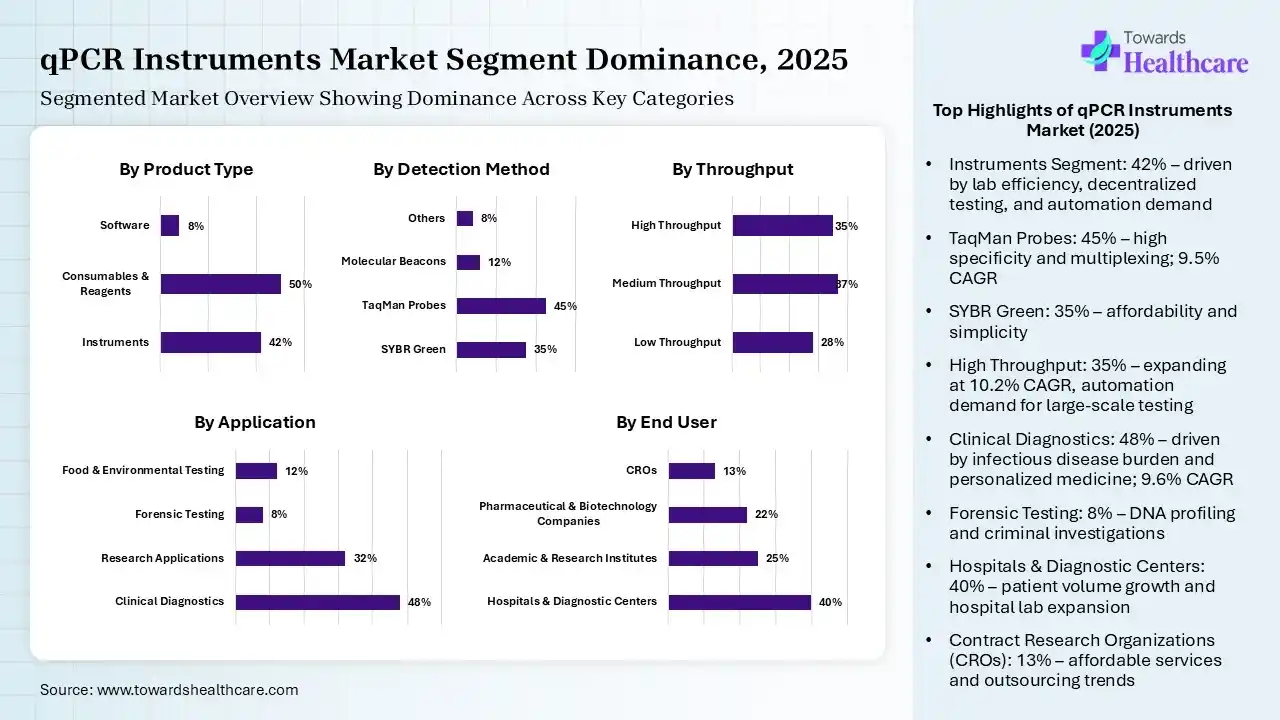
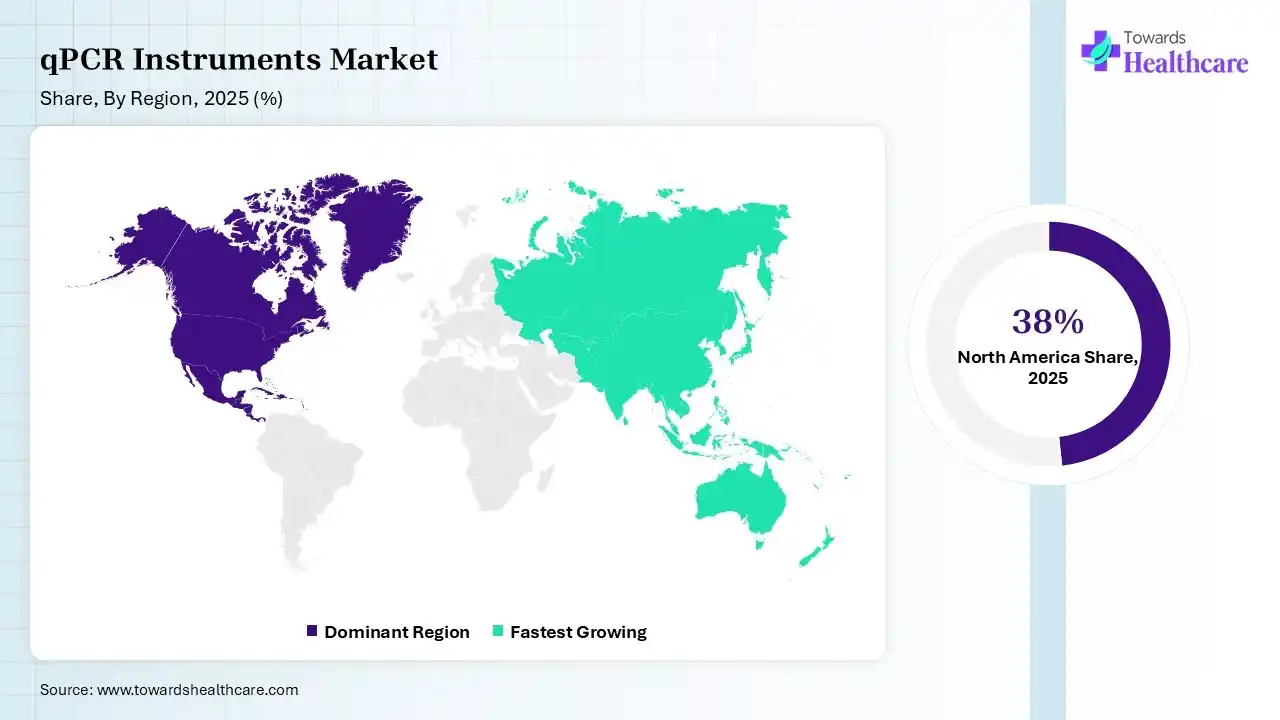
CAGR provides a standardized, compounding-adjusted growth measure enabling comparison across technology segments, geographies, and product categories regardless of market size or base year. All CAGR projections are reviewed against:

Principal Consultant
Payal Rabde is a Healthcare Market Research Analyst at Towards Healthcare Research & Consulting with 4+ years of experience in pharmaceuticals, biotechnology, medical devices, and life sciences.
Learn more about Payal Rabde

Reviewed By
Aditi Shivarkar is a seasoned professional with over 14 years of experience in healthcare market research. As a content reviewer, Aditi ensures the quality and accuracy of all market insights and data presented by the research team.
Learn more about Aditi Shivarkar


 +1 804-441-9344