

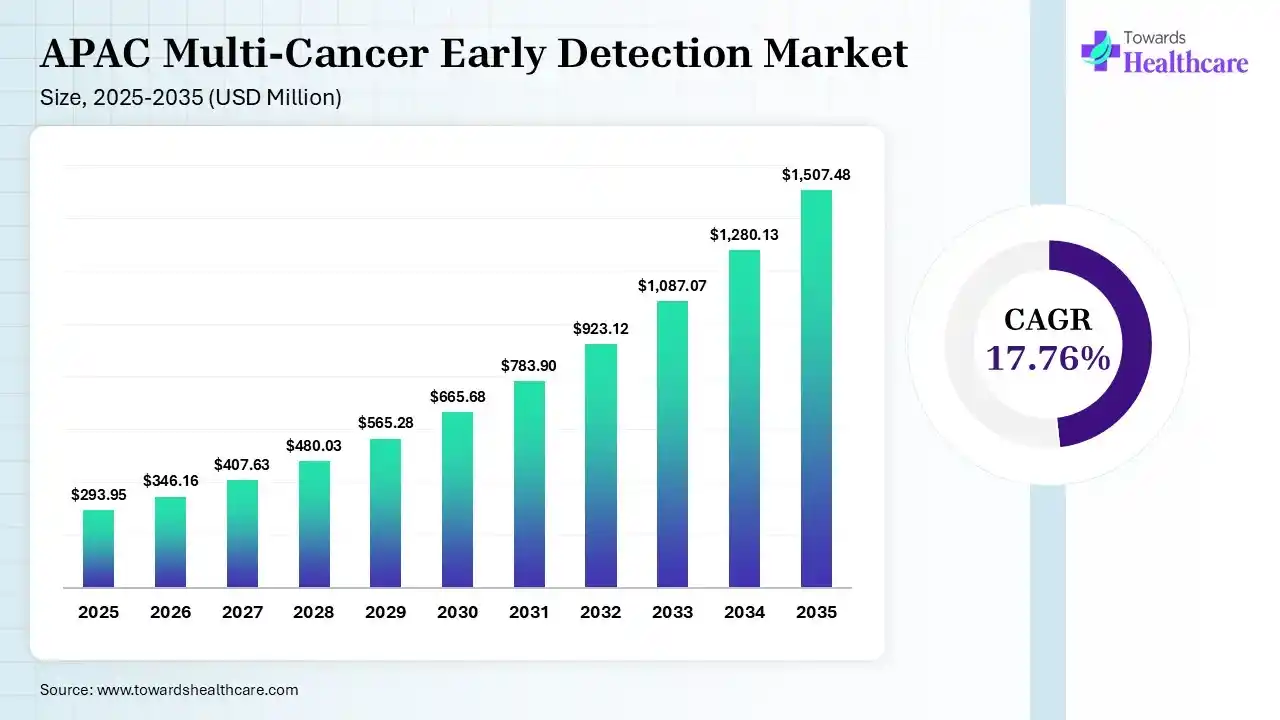
Research indicates strong growth opportunities in the APAC multi-cancer early detection market. The APAC multi-cancer early detection market size was estimated at USD 293.95 million in 2025 and is predicted to increase from USD 346.16 million in 2026 to approximately USD 1507.48 million by 2035, expanding at a CAGR of 17.76% from 2026 to 2035. Analysis also highlights that the APAC multi-cancer early detection market is rapidly expanding due to increasing cancer incidence, health awareness, R&D activities, multiplex protein panels, and expanding genomic infrastructure.
APAC multi-cancer early detection refers to tests utilizing blood or other body fluids for the identification of biomarkers responsible for detecting the presence of cancer cells. They help in the detection of cancer at early stages even before the appearance of their symptoms. Additionally, the report covers different types of tests, biomarkers, technologies, samples, cancers, their stages, end users, test applications, along with their market shares, regional growth, TAM/SAM/SOM analysis, and consumer and buyer intelligence.
| Metric | Value |
| 2025 Market Size | US$293.95 Million |
| 2025–2035 CAGR | 17.76% |
| Market Position | High-growth molecular cancer-screening market |
| Core Growth Areas | Liquid biopsy, DNA methylation, NGS, AI-assisted classification, multi-omics |
| Fastest-Growing Region | Asia-Pacific |
| Key Commercial Markets | China, India, Japan, South Korea, Australia, Singapore |
As per our research, the above-mentioned table highlights that the market is expected to expand due to increasing cancer burden, expansion of genomic and molecular-diagnostic infrastructure, greater interest in minimally invasive screening, and development of assays capable of detecting molecular cancer signals before symptoms appear, where blood-based testing is anticipated to show strong commercial opportunity as a single specimen can potentially support molecular interrogation across multiple cancer types.
Analyst View - Market Size
Clinical validation, regulatory acceptance, reimbursement, and diagnostic follow-up infrastructure are likely to drive the market's commercial development, where the ability to generate signals from a minimally invasive sample while supporting multi-cancer classification supports a strong development rationale for liquid-biopsy and methylation-based platforms.
Furthermore, stage-shift value, clinical utility, and an efficient diagnostic pathway after a positive result contribute to the principal opportunity for vendors. Additionally, earlier commercialization opportunities can be provided by sectors with established sequencing laboratories and private preventive-health channels, whereas health-system economics and evidence are anticipated to contribute to population-scale adoption.
Liquid Biopsy Segment Dominates the Market with 44% share in 2025
| Segment/Sub-segment | Share | CAGR | Market Intelligence |
| Liquid Biopsy | 44.00% | 18.65% | Blood-based testing reduces procedural burden and enables repeated molecular sampling. Expanding ctDNA and methylation research supports adoption. |
| ctDNA Tests | 19.00% | 19.20% | Tumor-derived molecular signals; NGS improves low-frequency alteration detection. |
| CTC Tests | 8.00% | 16.40% | Cellular cancer signals supported by improving enrichment technologies. |
| cfDNA Tests | 10.00% | 19.05% | Minimally invasive screening with sequencing-based fragmented DNA analysis. |
| Exosome/Extracellular Vesicle Tests | 7.00% | 21.10% | Fastest-growing; exosomes carry diverse tumor-associated molecules and support multi-biomarker development. |
| Gene Panel | 28.00% | 16.75% | Targeted sequencing lowers testing complexity and supports multiplex cancer-associated alteration analysis. |
| Targeted Gene Panels | 14.00% | 16.60% | Targeted sequencing and established oncology workflows support adoption. |
| Multi-Gene Mutation Panels | 9.00% | 17.10% | Multiplex mutation analysis addresses heterogeneous tumor signals. |
| Cancer Driver Gene Panels | 5.00% | 16.40% | Driver mutations provide clinically relevant molecular signals. |
| Laboratory-Developed Tests (LDTs) | 20.00% | 17.35% | Specialized laboratories can commercialize adaptable assays through centralized workflows. |
| Centralized Laboratory Tests | 9.00% | 17.00% | High-throughput centralized processing improves laboratory economics. |
| Clinician-Ordered LDTs | 6.00% | 17.40% | Physician ordering connects testing with clinical pathways. |
| Prescription-Based MCED Tests | 5.00% | 18.00% | Structured clinical oversight can support follow-up after positive results. |
| Other Tests | 8.00% | 15.80% | Protein, metabolomic, and multi-omic approaches diversify biomarker strategies. |
| Protein Biomarker Panels | 3.50% | 15.20% | Multiplex protein analysis complements genomic signals. |
| Multi-Omics Tests | 3.00% | 19.30% | Integrated biological signals can improve classification breadth. |
| Metabolomic Tests | 1.50% | 14.70% | MS-based metabolic profiling supports biomarker discovery. |
Based on our research, the table highlights different types of tests, market share, and CAGR. The liquid biopsy segment held the dominant share of 44% in 2025 because it reduced procedural burden and enabled repeated molecular sampling. The exosome/extracellular vesicle tests subsegment is expected to expand rapidly with a 21.10% CAGR during the forecast period, due to research improving isolation and characterization methods and increasing commercial interest.
Analyst View - Test Type
The liquid biopsy segment led the market while the exosome/extracellular vesicle tests subsegment is the fastest-growing category. A shift towards tests combining several circulating signals rather than relying on a single biomarker class drives competitive opportunity, whereas vendors with centralized laboratory networks are expected to potentially scale complex assays more efficiently compared to decentralized models.
DNA-Based Biomarkers Segment Leads the Market with 57%
| Segment/Sub-segment | Share | CAGR | Market Intelligence |
| DNA-Based Biomarkers | 57.00% | 18.35% | Tumor-derived DNA provides measurable circulating signals and benefits from advances in sequencing and methylation analysis. |
| DNA Methylation | 24.00% | 20.15% | Fastest-growing; methylation patterns can support tissue-of-origin classification. |
| Genetic Mutations | 16.00% | 17.50% | NGS enables multiplex mutation analysis. |
| Fragmentation Patterns | 10.00% | 18.90% | Fragmentomic signatures complement mutation detection. |
| Copy-Number Alterations | 7.00% | 16.80% | Broad genomic profiling captures tumor-associated copy-number changes. |
| RNA-Based Biomarkers | 13.00% | 17.85% | RNA reflects active cellular processes and supports multiplex biomarker research. |
| Circulating RNA | 5.00% | 17.60% | Non-invasive tumor-biology signal. |
| MicroRNA | 5.00% | 18.30% | Cancer-associated expression signatures support diagnostic development. |
| Messenger RNA | 3.00% | 17.10% | Transcriptomic signals broaden molecular characterization. |
| Protein-Based Biomarkers | 18.00% | 16.35% | Established immunoassay infrastructure supports scalable protein testing. |
| Tumor-Associated Proteins | 10.00% | 15.90% | Familiar biomarkers and automated immunoassay workflows support adoption. |
| Multiplex Protein Panels | 8.00% | 16.90% | Multiplexing increases information obtained from one sample. |
| Multi-Omics Biomarkers | 12.00% | 19.70% | Integrated signals can compensate for limitations of individual biomarkers. |
| Genomics + Proteomics | 4.00% | 18.90% | Complementary molecular layers broaden biological coverage. |
| Genomics + Methylation | 4.00% | 20.10% | Mutation and methylation capture different tumor signals. |
| Integrated Multi-Omics | 4.00% | 20.30% | Multiple molecular layers and AI-based integration support advanced classification. |
The given table illustrates that the DNA-based biomarkers segment held the largest share of 57% of the market in 2025, as it provided measurable circulating signals and improved sensitivity. The DNA methylation subsegment held 24% in 2025 and is anticipated to show the highest growth of 20.15% CAGR during the predicted period, as Aberrant methylation patterns occur across multiple cancers.
Analyst View - Biomarkers
DNA-based biomarkers segment dominated the market, but the growth profile is favored by DNA methylation and integrated multi-omics. Therefore, a commercial foundation is provided by established DNA-based assays, while multimodal platforms are being developed to increase sensitivity and improve tissue-of-origin classification.
NGS Segment Held a Dominant Share of 38% of the Market
| Technology | Share | CAGR |
| NGS | 38.00% | 18.30% |
| Whole-Genome Sequencing | 8.00% | 17.70% |
| Targeted Sequencing | 21.00% | 18.50% |
| Hybrid-Capture Sequencing | 9.00% | 19.10% |
| PCR / Digital PCR | 17.00% | 16.75% |
| qPCR | 7.00% | 15.70% |
| Digital PCR | 6.00% | 17.90% |
| Droplet Digital PCR | 4.00% | 18.20% |
| Methylation Profiling | 15.00% | 20.20% |
| Bisulfite Sequencing | 6.00% | 19.30% |
| Enzymatic Methylation Analysis | 5.00% | 21.00% |
| Methylation-Specific PCR | 4.00% | 20.40% |
| Immunoassays | 10.00% | 15.40% |
| ELISA | 6.00% | 14.90% |
| Multiplex Immunoassays | 4.00% | 16.20% |
| Mass Spectrometry | 7.00% | 16.90% |
| Proteomics | 4.00% | 16.50% |
| Metabolomics | 3.00% | 17.40% |
| Bioinformatics & AI | 8.00% | 20.00% |
| Machine Learning | 3.00% | 19.70% |
| Cancer Signal Classification | 3.00% | 20.20% |
| Tissue-of-Origin Prediction | 2.00% | 21.00% |
| Microfluidics & Lab-on-a-Chip | 5.00% | 19.00% |
As per the analysis, the table highlights different samples, along with their market share and CAGR. The NGS segment held the major share of 38% in 2025 as it supported high-dimensional molecular profiling. The methylation profiling segment held a 15% market share and is predicted to show the fastest growth with a 20.20% CAGR during the upcoming years, as methylation signatures are attractive for multi-cancer detection.
Analyst View - Technology
The importance of multiplex molecular analysis is reflected by NGS segment dominance, whereas differentiation increasingly occurring at the interpretation layer is highlighted by the fast-growing methylation profiling segment. Therefore, a combination of sample processing, molecular measurement, and computational classification is likely to be offered by the strongest commercial platforms.
Blood Segment Contributed to 78% of Market Share
| Sample Type | Share | CAGR |
| Blood | 78.00% | 18.45% |
| Plasma | 52.00% | 18.80% |
| Serum | 18.00% | 17.10% |
| Whole Blood | 8.00% | 19.10% |
| Urine | 8.00% | 17.30% |
| Cell-Free DNA | 4.00% | 18.20% |
| Protein Biomarkers | 2.50% | 16.20% |
| Metabolites | 1.50% | 18.60% |
| Saliva/Oral Fluid | 5.00% | 20.10% |
| cfDNA | 2.00% | 19.60% |
| RNA Biomarkers | 1.50% | 20.30% |
| Protein Biomarkers | 1.50% | 20.50% |
| Stool | 5.00% | 15.80% |
| DNA Biomarkers | 3.00% | 16.10% |
| Protein Biomarkers | 2.00% | 15.40% |
| Other Body Fluids | 4.00% | 20.40% |
| Cerebrospinal Fluid | 2.00% | 19.80% |
| Pleural Fluid | 2.00% | 21.00% |
The above-mentioned table confirms that the blood segment led the market with a 78% share in 2025 due to its minimally invasive sampling and it provided circulating tumor-derived biomarkers. The saliva/oral fluid segment held 5% market share in 2025 and is expected to expand rapidly with a 20.10% CAGR during the forecast period, due to its simple and non-invasive approach.
Analyst View - Sample Type
The highest share held by the blood segment contributes to near-term commercialization of phlebotomy and centralized laboratory infrastructure. On the other hand, the potential value of easier collection and decentralized screening is highlighted by the fastest-growing saliva/oral fluid segment.
Lung Cancer Segment Held Major Revenue Share of 17%
| Cancer Type | Share | CAGR |
| Lung Cancer | 17.00% | 18.20% |
| Breast Cancer | 15.00% | 17.10% |
| Colorectal Cancer | 13.00% | 17.60% |
| Liver Cancer | 12.00% | 20.20% |
| Pancreatic Cancer | 9.00% | 21.30% |
| Stomach / Gastric Cancer | 10.00% | 18.80% |
| Ovarian Cancer | 6.00% | 19.50% |
| Prostate Cancer | 6.00% | 16.80% |
| Esophageal Cancer | 5.00% | 19.20% |
| Other Cancers | 7.00% | 19.00% |
Based on the information gathered, the table covers various types of cancer, market share, and CAGR. The lung cancer segment registered dominance over the market with a 17% share in 2025, driven by a high cancer burden, which increased screening demand. The pancreatic cancer segment is expected to show the highest growth with a CAGR of 21.30% during the upcoming years, due to its early-detection challenges.
Analyst View - Cancer Type
The lung cancer segment led the market, while the pancreatic cancer segment is expanding rapidly, whereas the market also promotes a strong rationale for gastric, liver, and esophageal cancer applications. It also highlights that commercial rationale is strongest for cancers where conventional early detection is difficult or where existing screening coverage is limited.
Stage I Segment Led the Market with 29%
| Stage | Share | CAGR |
| Stage I | 29.00% | 20.80% |
| Stage II | 25.00% | 18.90% |
| Stage III | 18.00% | 16.40% |
| Stage IV | 12.00% | 14.80% |
| Pre-Symptomatic/Pre-Diagnostic Population | 16.00% | 20.50% |
As per the survey conducted, the table suggests that the stage I segment held the dominant share of 29% in 2025 and is anticipated to grow at the fastest CAGR of 20.80% during the predicted period, due to MCED development emphasizing earlier-stage identification and molecular detection, which can complement conventional screening.
Analyst View - Cancer Stage
The stage I segment contributes to the largest category and fastest growth among defined cancer stages, indicating that the central commercial objective of MCED is shifting detection toward earlier disease. Additionally, the screening population is also represented by the pre-symptomatic/pre-diagnostic population.
Hospitals & Health Systems Segment Dominates the Market with 38% share in 2025
| End User | Share | CAGR |
| Hospitals & Health Systems | 38.00% | 17.60% |
| Public Hospitals | 16.00% | 17.30% |
| Private Hospitals | 15.00% | 18.10% |
| Academic Medical Centers | 7.00% | 19.30% |
| Diagnostic Laboratories | 31.00% | 18.60% |
| Centralized Diagnostic Laboratories | 14.00% | 18.30% |
| Molecular Diagnostic Laboratories | 10.00% | 19.10% |
| Pathology Networks | 7.00% | 18.50% |
| Cancer Screening Centers | 12.00% | 20.20% |
| Population Screening Centers | 7.00% | 20.40% |
| Preventive Health Centers | 5.00% | 19.90% |
| Specialty Clinics | 9.00% | 18.70% |
| Research Institutes | 6.00% | 19.60% |
| Corporate/Employer Health Programs | 4.00% | 21.00% |
Based on our research, the table highlights different types of end users, market share, and CAGR. The hospitals & health systems segment held the dominant share of 38% in 2025 because hospitals integrated screening with clinical follow-up. The corporate/employer health programs segment is expected to expand rapidly with a 21% CAGR during the forecast period, as they are increasingly investing in preventive health.
Analyst View - End User
The hospitals and health systems segment registered dominance, while the corporate/employer health systems segment accounted for the fastest-growing category, creating a separate preventive-health channel outside conventional hospital procurement. Furthermore, the diagnostic laboratories segment is considered strategically important as it offers networks that can centralize sequencing, sample processing, and interpretation.
Population Screening Segment Leads the Market with 42%
| Application | Share | CAGR |
| Population Screening | 42.00% | 19.30% |
| Average-Risk Adults | 20.00% | 18.90% |
| Elevated-Risk Adults | 15.00% | 19.80% |
| Age-Based Screening | 7.00% | 20.20% |
| High-Risk Screening | 24.00% | 18.60% |
| Family History | 9.00% | 18.10% |
| Genetic Predisposition | 8.00% | 19.60% |
| Lifestyle-Associated Risk | 7.00% | 18.00% |
| Symptom-Free Cancer Detection | 14.00% | 20.50% |
| Complementary Screening | 13.00% | 17.90% |
| Breast Cancer Screening | 3.00% | 17.30% |
| Cervical Cancer Screening | 2.00% | 16.90% |
| Colorectal Cancer Screening | 4.00% | 18.30% |
| Lung Cancer Screening | 2.00% | 19.50% |
| Prostate Cancer Screening | 2.00% | 17.20% |
| Integrated Cancer Screening Programs | 7.00% | 21.00% |
The given table illustrates that the population screening segment held the largest share of 42% of the market in 2025, as large populations created substantial screening demand. The integrated cancer screening programs segment held a 7% share in 2025 and is anticipated to show the highest growth of 21% CAGR during the predicted period, as they provide combined multiple screening modalities.
Analyst View - Application
The population screening segment accounts for the principal application, while the integrated cancer screening programs segment contributes to the highest-growing applications, which indicates that the MCED is increasingly positioned as a component of broader screening pathways and not an isolated replacement for existing cancer-specific screening.
| Region / Country | Share | CAGR |
| Asia-Pacific - Regional Share | 25.00% | 20.10% |
| China | 31.00% | 20.00% |
| Japan | 20.00% | 18.40% |
| India | 18.00% | 22.30% |
| South Korea | 10.00% | 21.00% |
| Australia | 6.00% | 18.70% |
| Singapore | 4.00% | 22.00% |
| Taiwan | 3.00% | 21.40% |
| Thailand | 3.00% | 20.60% |
| Vietnam | 2.50% | 23.00% |
| Indonesia | 1.50% | 22.10% |
| Malaysia | 1.50% | 21.30% |
| Other APAC | 1.00% | 23.50% |
As per our research, the table covers various regions across APAC, along with their market share and CAGR. China dominated the market with 31% in 2025 due to its large population, expanding molecular-diagnostics infrastructure, and substantial cancer burden, creating a major screening opportunity, where its MCED segment at US$57.3 million in 2024 is expected to surpass double its value by 2030. India is anticipated to show the highest CAGR among the major APAC markets at 22.30% due to expansion of genomic laboratories, molecular testing capacity, and demand for more affordable diagnostic technologies, where decentralized and centralized laboratory models promoting affordability and geographic accessibility are driving India's market-development opportunity.
Analyst View - Region
In the rapidly expanding APAC market (20.10% CAGR), India, Vietnam, Singapore and Indonesia show particularly high growth rates, whereas larger established healthcare and diagnostics ecosystems are provided by China, Japan and South Korea.
Thus, commercial strategies are differentiated as;
| Factor | Research Pointer | Real Data/Market Intelligence | Strategic Interpretation |
| TAM | APAC MCED market | US$293.95M in 2025 | Represents the supplied full commercial APAC market opportunity. |
| TAM | Market growth | 17.76% CAGR, 2025–2035 | Rapid market expansion increases the long-term addressable opportunity. |
| TAM | Regional opportunity | Towards Healthcare identifies APAC as a high-growth Pre-Dx Oncology region and MCED as a high-growth solution category. | Cancer burden, molecular diagnostics, and preventive screening support addressable-market expansion. |
| TAM | Country opportunity | China, India, Japan, South Korea, Australia and Southeast Asia | Opportunity varies by population scale, healthcare infrastructure, and regulatory readiness. |
| SAM | Blood-based MCED | Liquid biopsy is a major Pre-Dx Oncology segment; MCED is identified as a fast-growing testing category. | Blood-based testing represents the most directly serviceable technology opportunity. |
| SAM | Technology-ready laboratories | NGS, targeted sequencing, methylation profiling and PCR/dPCR | Existing molecular infrastructure can reduce implementation barriers. |
| SAM | Healthcare buyers | Hospitals, diagnostic laboratories, pathology networks, screening centers | These organizations already possess sample collection and diagnostic infrastructure. |
| SAM | Priority markets | China, India, Japan, South Korea, Taiwan, Thailand and Vietnam | These markets combine cancer-screening demand with expanding molecular-testing activity. |
| SOM | Obtainable market | Must be derived from reachable facilities, regulatory status, reimbursement, and test capacity | A fixed percentage of TAM would not provide a defensible SOM. |
| SOM | Bottom-up model | Reachable facilities × annual tests/facility × realized revenue/test | Allows market opportunity to be modeled country-by-country. |
| SOM | Early channels | Private diagnostics, preventive-health providers, employer programs | These channels may provide defined commercial entry points before broad population reimbursement. |
Analyst View - TAM/SAM/SOM
The US$293.95 million TAM accounts for the top-down market boundary, whereas commercially relevant SAM revolves around blood-based molecular testing and laboratories already equipped for genomic analysis, while SOM is expected to be constructed bottom-up instead of applying an arbitrary percentage.
The practical models cover:
SOM = Contracted/Reachable Facilities × Annual MCED Tests per Facility × Realized Revenue per Test
Therefore, this supports the incorporation of regulatory approval, reimbursement, and laboratory reach, along with separate scenarios for China, India, Japan, South Korea, Australia, and Southeast Asia.
| Consumer Factor | Market Intelligence | Commercial Implication |
| Non-invasive testing | Liquid biopsy reduces procedural burden compared with tissue-based sampling. | Blood-based propositions can emphasize convenience and repeatability. |
| Early detection | MCED is designed around identifying molecular cancer signals before symptoms. | Earlier detection is the central consumer value proposition. |
| Multi-cancer coverage | One testing pathway can evaluate signals associated with multiple cancers. | Broader coverage can differentiate MCED from single-cancer screening. |
| Convenience | Blood collection uses established healthcare infrastructure; oral-fluid technologies offer additional convenience. | Simplified collection can support preventive screening participation. |
| Trust | Clinical validation and regulatory acceptance remain essential. | Consumer demand is closely tied to physician confidence and evidence. |
| Follow-up | Positive tests require diagnostic confirmation and clinical management. | Clear referral pathways are critical to maintaining trust. |
| Willingness to pay | Premium preventive-health channels can support early commercialization. | Private preventive-health and employer programs can provide initial access channels. |
Analyst View - Consumer Behavior
Based on the above-mentioned information, accurate, clinically meaningful, convenient, and actionable tests will drive consumer adoption rather than depending on the novelty of “multi-cancer” testing. Thus, it is essential to connect screening with a defined follow-up pathway as per the commercial proposition.
| Buyer Group | Key Requirements | Procurement Considerations |
| Hospitals & Health Systems | Clinical utility, sensitivity/specificity, workflow integration | Physician adoption, follow-up pathways, reimbursement, outcomes |
| Diagnostic Laboratories | Analytical performance, throughput, automation | Cost/test, instrumentation, turnaround time, scalability |
| Cancer Screening Centers | High-volume processing | Population economics, sample logistics, reporting |
| Specialty Clinics | Targeted high-risk populations | Physician ordering, clinical evidence, integration |
| Research Institutes | Biomarker performance and datasets | Assay flexibility, sequencing capabilities, research partnerships |
| Public-Health Programs | Population-level outcomes | Cost-effectiveness, equity, evidence, national cancer programs |
| Pharma & Biotech | Biomarker discovery, patient stratification | Data quality, molecular platforms, research partnerships |
| Employers/Payers | Preventive-health outcomes | Cost per participant, participation rates, healthcare economics |
| Technology Partners | Platform integration | Data interoperability, AI, sequencing and laboratory connectivity |
As per the survey conducted by our multidisciplinary strategist, Aman Singh, different types of buyer groups, their key requirements, and procurement considerations are covered in this table. They are driven by key purchasing criteria like clinical sensitivity and specificity, stage I detection performance, cancer-type coverage, tissue-of-origin accuracy, clinical validation, regulatory status, reimbursement availability, cost per test, turnaround time, laboratory integration, sample stability and logistics, positive-result follow-up pathway, data security and reporting requirements, and scalability across multiple facilities.
Analyst View - Buyer Intelligence
The buyer landscape is divided between clinical buyers seeking actionable diagnostic utility and commercial/preventive buyers seeking scalable screening economics. Additionally, centralizing expensive sequencing and computational infrastructure makes diagnostic laboratories important, whereas to reduce the need to build independent infrastructure in every country, partnerships with laboratory networks, hospitals, and preventive-health providers are considered important among the vendors.
Based on the assessment, the market is expanding rapidly due to increasing cancer burden. The growth in health awareness and minimally invasive diagnostics is also driving market growth. The new collaboration among the major companies can accelerate the development of advanced multi-cancer early detection solutions and enhance their accessibility. The strong growth in multi-omics tests and NGS can also create new market opportunities.
Payal Rabde, Senior Research Analyst, led the primary market research, developed the methodology, analysed trends, segmentation, competition, forecasts, and strategic opportunities, forming the report's analytical foundation.
Aman Singh, a multidisciplinary strategist, was responsible for collecting and validating clinical trial data, research publications, company information, partnerships, and other quantitative datasets, strengthening evidence-based analysis and market estimations.
Aditi Shivarkar, an expert business strategist, reviewed the complete research document, performed quality checks, validated findings, refined content, corrected inconsistencies, and finalized the report, ensuring accuracy, clarity, credibility, and publication-ready quality.
By Test Type
By Biomarker Type
By Technology
By Sample Type
By Cancer Type
By Cancer Stage
By End Use
By Test Application
By Region


Principal Consultant
Payal Rabde is a Healthcare Market Research Analyst at Towards Healthcare Research & Consulting with 4+ years of experience in pharmaceuticals, biotechnology, medical devices, and life sciences.
Learn more about Payal Rabde

Reviewed By
Aditi Shivarkar is a seasoned professional with over 14 years of experience in healthcare market research. As a content reviewer, Aditi ensures the quality and accuracy of all market insights and data presented by the research team.
Learn more about Aditi Shivarkar