
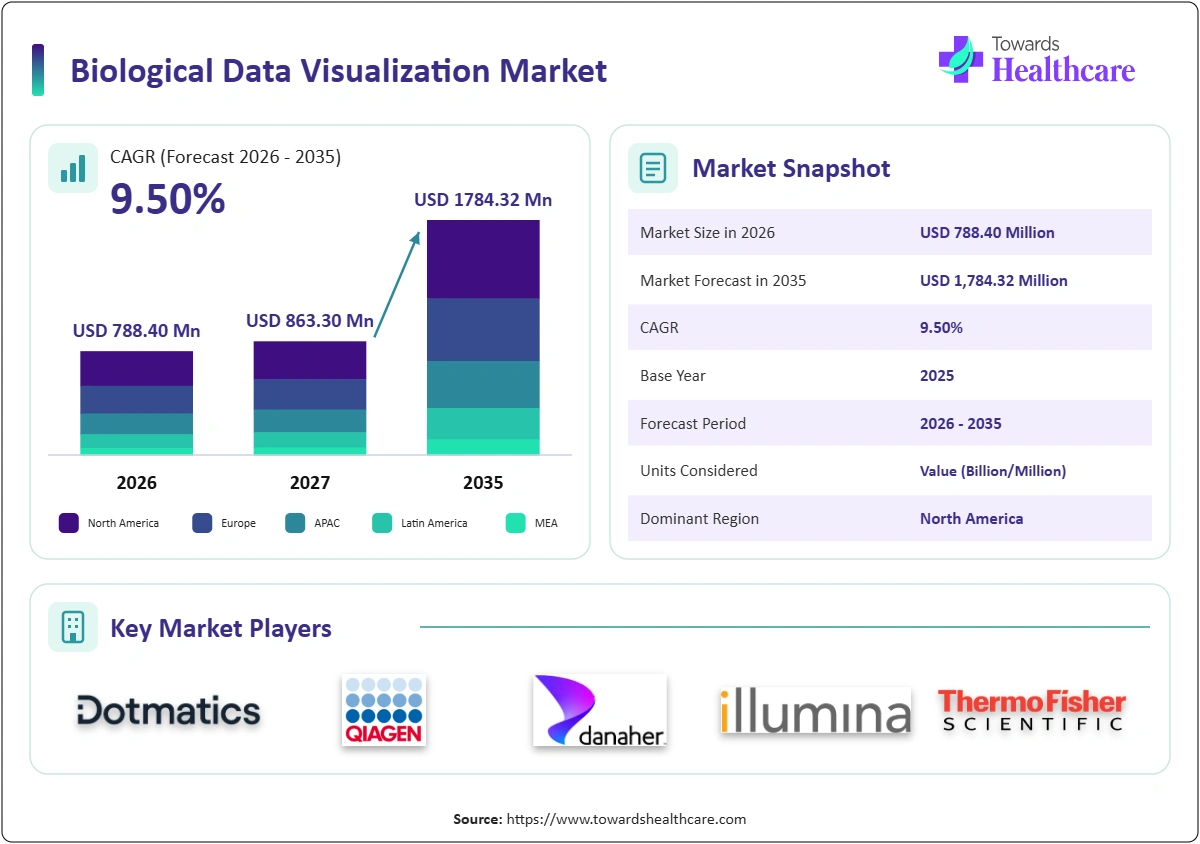
The biological data visualization market is projected to grow from USD 720.00 million in 2025 to USD 1,784.32 million by 2035 because sequencing, imaging and structural biology produce rapidly growing volumes of complex data that researchers and drug developers can only interpret through specialised visualization software. Growth of single-cell, spatial and multi-omics studies, AI-assisted analysis, cloud platforms, high-content imaging and wider use by pharmaceutical companies support strong growth, lifting the market to USD 1,133.45 million by 2030 and sustaining a CAGR of 9.50% from 2026 to 2035.
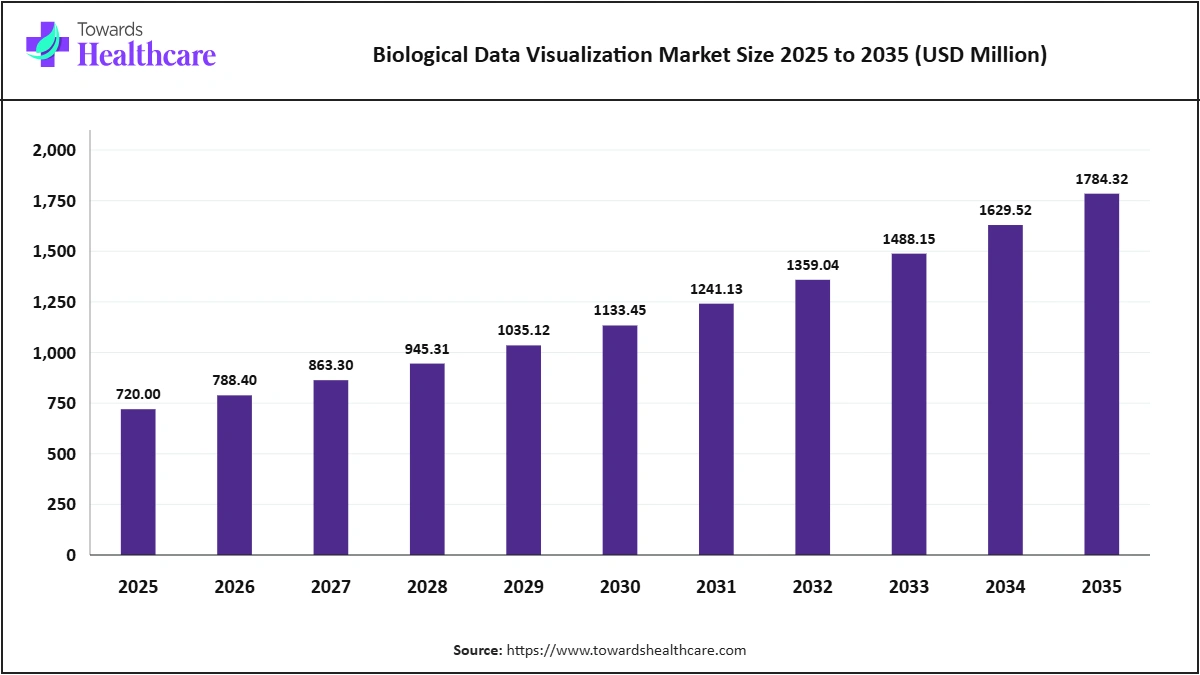
Analyst View: The market estimate was developed by assessing the number of users and software licences across different techniques, applications, deployment models, end-user groups and regions. These estimates were multiplied by the corresponding average licence and subscription prices. The assessment also included visualization modules bundled with sequencing and imaging instruments.
User estimates were based on factors such as research funding, sequencing and imaging activity, and the adoption of visualization tools in drug discovery. Pricing assumptions accounted for the different commercial models available, including desktop licences, enterprise software platforms and cloud-based subscriptions.
The overall market estimate was cross-checked against the software revenues of leading bioinformatics, imaging and scientific software companies, as well as published market estimates. This comparison placed the 2025 base-year estimate slightly above the highest credible comparable figure. The forecast growth rate reflects rising demand for single-cell, spatial and AI-driven data analysis, which is expected to support growth above some comparable market estimates. However, the impact of freely available open-source tools and constrained academic budgets is expected to moderate market expansion.
Driver: Sequencing and imaging data grow fast. Single-cell and spatial biology need new tools. Drug discovery uses multi-omics data. AI needs clear outputs. Cloud enables collaboration.
Restraint: Free open-source tools compete. Academic budgets are tight. Data volumes strain computing. Skills gaps limit use. Data privacy and security concerns.
Opportunity: AI-driven insight generation. Clinical genomics visualization. Emerging market research growth. Multi-modal data integration. Subscription cloud platforms.
Note: 2025 is the base year; 2035 values are forecasts.
Sources: Expert interviews, secondary sources, Towards Healthcare database and Towards Healthcare analysts.
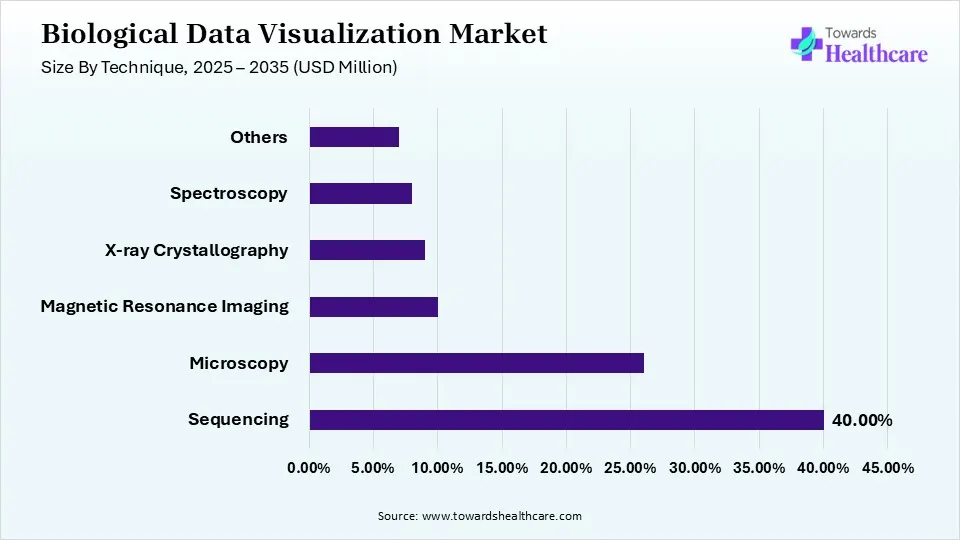
Sequencing: Sequencing-based visualization accounted for 40.00% of the biological data visualization market in 2025, representing a value of USD 288.00 million. The segment is projected to reach USD 687.22 million by 2035, registering a CAGR of 9.09% over the forecast period. These visualization tools include genome browsers, variant viewers, gene expression heat maps, single-cell clustering plots and spatial transcriptomics maps. The segment holds the largest share among visualization techniques, supported by the widespread use of next-generation sequencing in research and drug discovery. The growing volume and complexity of sequencing data are increasing the need for tools that help researchers explore, interpret and analyse biological information.
Microscopy visualization covers software for confocal, light-sheet, super-resolution, high-content, and electron microscopy images, including 3D and 4D rendering, segmentation, and quantitative image analysis, offered by imaging companies such as ZEISS, Leica Microsystems, Evident, and Oxford Instruments.
MRI visualization tools are used in preclinical and research imaging to examine tissues, organs and small-animal models. The segment is expected to record the fastest growth among visualization techniques, supported by the increasing use of functional and preclinical imaging in neuroscience research and drug development. Advances in 3D visualization tools are also improving the ability of researchers to analyse and interpret complex imaging data.
X-ray crystallography visualization displays electron density maps and protein and complex structures used in structural biology and structure-based drug design.
These visualization tools support the analysis of data generated through techniques such as mass spectrometry and nuclear magnetic resonance (NMR) spectroscopy. They are widely used in proteomics, metabolomics and molecular structure analysis, helping researchers interpret complex spectral data and identify relevant biological patterns.
Others include cryo-electron microscopy, flow cytometry and other visualization techniques.
Note: 2025 is the base year; 2035 values are forecasts.
Sources: Expert interviews, secondary sources, Towards Healthcare database and Towards Healthcare analysts.
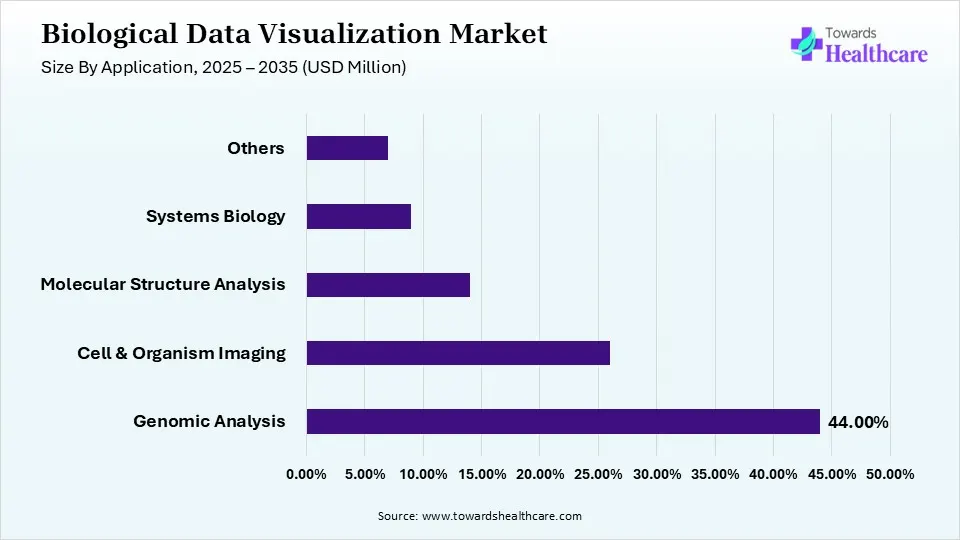
Genomic Analysis: Genomic analysis accounted for 44.00% of the biological data visualization market in 2025, valued at USD 316.80 million. The segment is projected to reach USD 751.62 million by 2035, registering a CAGR of 9.02% over the forecast period. It represents the largest application segment, as visualization tools are widely used to analyse and interpret genomic data, including whole genomes, genetic variants, gene expression patterns, epigenetic changes, and single-cell and spatial datasets. These tools support activities ranging from basic biological research and diagnostic development to drug discovery.
Cell and organism imaging covers visualization of cells, tissues, and whole organisms from microscopy and imaging systems used in cell biology, neuroscience, and developmental biology.
Visualization tools in this segment enable the three-dimensional analysis of proteins, nucleic acids, and drug molecules. They are widely used in structural biology and drug design, helping researchers examine molecular structures, understand interactions, and support the development of potential drug candidates.
Systems biology is the fastest-growing application, covering network, pathway and multi-omics visualization that integrates genomic, proteomic and metabolic data, increasingly supported by AI.
Others include phylogenetics, ecology and education uses.
Note: 2025 is the base year; 2035 values are forecasts.
Sources: Expert interviews, secondary sources, Towards Healthcare database, and Towards Healthcare analysts.
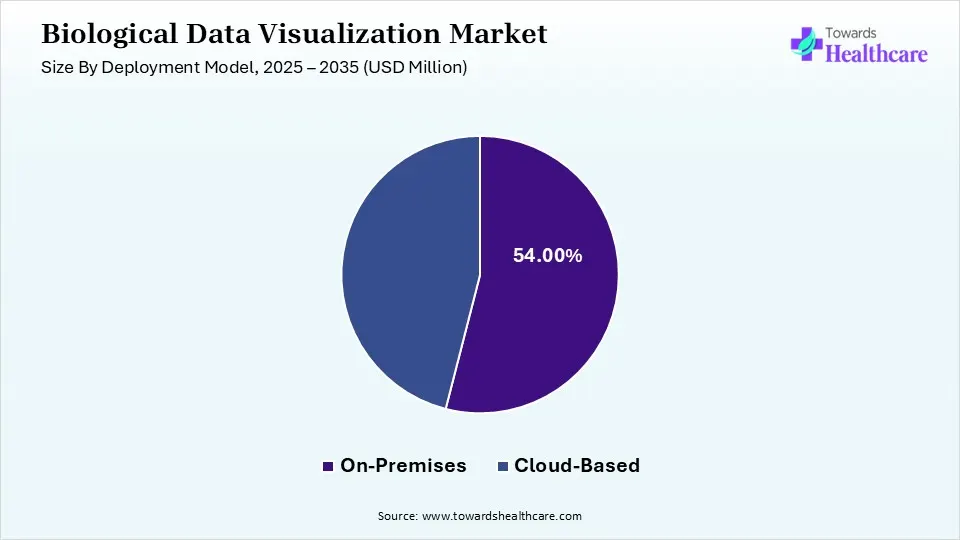
On-Premises: On-premises deployment accounted for 54.00% of the biological data visualization market in 2025, valued at USD 388.80 million. The segment is projected to reach USD 825.31 million by 2035, registering a CAGR of 7.82% over the forecast period. On-premises solutions remain the leading deployment model, as many research institutions and laboratories prefer to run visualization software on local workstations and servers connected to their instruments. This approach also allows organizations to maintain greater control over sensitive research data and manage large biological datasets within their own IT infrastructure.
Cloud-based deployment is growing faster because it allows teams to share and analyse large datasets from anywhere, scales computing power on demand and supports collaborative and AI-driven workflows.
Note: 2025 is the base year; 2035 values are forecasts.
Sources: Expert interviews, secondary sources, Towards Healthcare database and Towards Healthcare analysts.
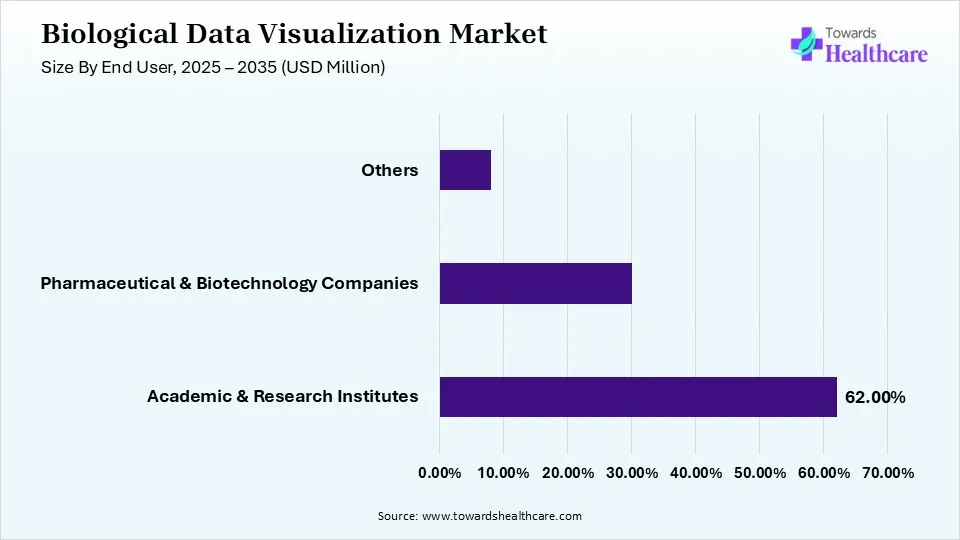
Academic & Research Institutes: Academic and research institutes accounted for 62.00% of the biological data visualization market in 2025, representing a value of USD 446.40 million. The segment is projected to reach USD 1,011.66 million by 2035, registering a CAGR of 8.53% over the forecast period. These institutions represent the largest end-user group, supported by the extensive use of visualization software across universities, government laboratories and research centres. Such organizations rely on these tools for genomic analysis, biological imaging and structural biology research.
Pharmaceutical and biotechnology companies are the fastest-growing users because they rely on multi-omics, imaging, and structural data for target discovery, biomarker research, and drug development, and invest in enterprise and AI-enabled platforms.
Others include contract research organisations, hospitals and clinical laboratories.
Analyst View: Segment values were allocated by matching users, licences and prices to techniques, applications, deployment models and end users, using company portfolios and research activity. Sequencing, genomic analysis, on-premises deployment and academic users lead. We expect imaging, systems biology, cloud deployment and pharmaceutical users to gain share.
| Region | 2025 Share | 2025 Value (USD Million) | 2035 Value (USD Million) | CAGR 2026–2035 |
| North America | 45.00% | 324.00 | 756.19 | 8.85% |
| Europe | 27.00% | 194.40 | 470.67 | 9.25% |
| Asia Pacific | 20.00% | 144.00 | 418.00 | 11.25% |
| Latin America | 5.00% | 36.00 | 87.16 | 9.25% |
| Middle East & Africa | 3.00% | 21.60 | 52.30 | 9.25% |
Note: 2025 is the base year; 2035 values are forecasts.
Sources: Expert interviews, secondary sources, Towards Healthcare database, and Towards Healthcare analysts.
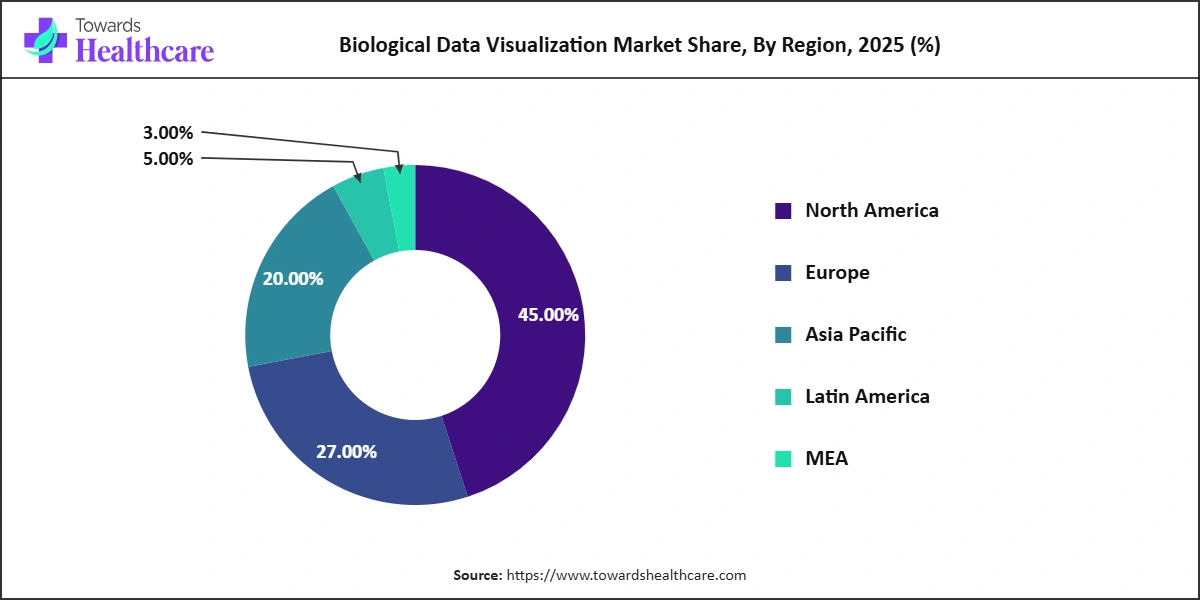
North America: North America accounted for 45.00% of the biological data visualization market in 2025, representing a value of USD 324.00 million. The regional market is projected to reach USD 756.19 million by 2035, growing at a CAGR of 8.85% during 2026-2035. North America holds the largest regional share, supported by substantial public and private funding for genomics and life sciences research, a well-established pharmaceutical and biotechnology industry, and the presence of major software and instrument companies such as Thermo Fisher Scientific, Illumina, Danaher, Agilent and 10x Genomics.
Europe: This region accounted for 27.00% (USD 194.40 million) of the biological data visualization market in 2025 and is projected to reach USD 470.67 million by 2035, expanding at a CAGR of 9.25% from 2026 to 2035. Europe has strong academic research, large genomics programmes and biobanks, leading imaging companies such as ZEISS and Oxford Instruments, and QIAGEN's bioinformatics business.
Asia Pacific: Asia Pacific accounted for 20.00% of the biological data visualization market in 2025, representing a value of USD 144.00 million. The regional market is projected to reach USD 418.00 million by 2035, growing at a CAGR of 11.25% during 2026-2035. It is expected to be the fastest-growing regional market, supported by rising research funding, expanding sequencing capacity in China and the growth of the biotechnology sector across China, Japan, South Korea, India and Singapore. Government-backed precision medicine programmes are also contributing to demand for biological data analysis and visualization tools.
Latin America: This region accounted for 5.00% (USD 36.00 million) of the biological data visualization market in 2025 and is projected to reach USD 87.16 million by 2035, expanding at a CAGR of 9.25% from 2026 to 2035. Latin America is supported by growing genomics research and academic collaborations in Brazil and Mexico.
Middle East & Africa: The Middle East and Africa accounted for 3.00% of the biological data visualization market in 2025, representing a value of USD 21.60 million. The regional market is projected to reach USD 52.30 million by 2035, growing at a CAGR of 9.25% based on the 2025-2035 figures. Market growth is supported by national genome programmes in Gulf countries and the gradual development of research infrastructure across the region. These initiatives are creating opportunities for wider adoption of biological data analysis and visualization tools.
Analyst View: Regional shares were built from research activity, users and licences in each region. North America leads because of its research funding and industry. We assign Asia Pacific the highest growth premium because research investment and sequencing capacity are expanding fastest there.
| Rank | Company Name | Market-Specific Revenue (USD Million) | 2025 Share | Key Products / Business | Headquarters |
| 1 | Thermo Fisher Scientific | 62.00 | 8.61% | Imaging and multi-omics visualization software | United States |
| 2 | Illumina | 55.00 | 7.64% | Genomic analysis and visualization software | United States |
| 3 | QIAGEN Digital Insights | 48.00 | 6.67% | CLC Genomics Workbench and bioinformatics | Netherlands |
| 4 | Dotmatics | 45.00 | 6.25% | Scientific data analysis and visualization | United States |
| 5 | Danaher | 40.00 | 5.56% | Imaging and analysis software | United States |
| 6 | ZEISS | 32.00 | 4.44% | Microscopy imaging and visualization software | Germany |
| 7 | Oxford Instruments | 26.00 | 3.61% | 3D and 4D image visualization software | United Kingdom |
| 8 | Agilent Technologies | 22.00 | 3.06% | Genomics and spectroscopy data software | United States |
| 9 | 10x Genomics | 18.00 | 2.50% | Single-cell and spatial visualization software | United States |
| 10 | Evident | 14.00 | 1.94% | Microscopy imaging software | Japan |
Note: Company revenues and shares are 2025 estimates.
Sources: Company press releases, expert interviews, secondary sources, Towards Healthcare database and Towards Healthcare analysts.
Thermo Fisher Scientific led the biological data visualization market with an estimated 8.61% (USD 62.00 million) of 2025 revenue, followed by Illumina at 7.64% (USD 55.00 million) and QIAGEN Digital Insights at 6.67% (USD 48.00 million). Thermo Fisher Scientific leads with imaging, structural, and multi-omics visualization software linked to its instruments. Illumina offers genomic analysis and visualization software for its sequencing systems, and QIAGEN Digital Insights provides the CLC Genomics Workbench and other bioinformatics tools. Dotmatics, now part of Siemens, Danaher, ZEISS, Oxford Instruments, Agilent Technologies, 10x Genomics and Evident compete through scientific data platforms, imaging software, microscopy visualization, 3D image analysis, genomics and spectroscopy software and single-cell and spatial tools.
The top 10 companies accounted for an estimated 50.28% (USD 362.00 million) of 2025 revenue, while the remaining 49.72% (USD 358.00 million) was shared among many specialised software developers, open-source projects and cloud bioinformatics providers. The biological data visualization market is fragmented, and competition centres on ease of use, ability to handle large and multi-modal datasets, integration with instruments and analysis pipelines, AI features, cloud collaboration, data security and price. Commercial vendors also compete with widely used free and open-source tools in academic research.
The biological data visualization ecosystem links instrument makers and data generators with software developers, cloud and computing providers, research users and drug developers.
| Ecosystem Stage | Role in the Market | Key Companies |
| Data Generation | Produce sequencing and imaging data | Illumina, Thermo Fisher, 10x Genomics, ZEISS, Evident |
| Software Developers | Build visualization and analysis tools | QIAGEN, Dotmatics, Oxford Instruments, Agilent |
| Cloud & Computing | Host and scale data | Cloud providers and bioinformatics platforms |
| Research Users | Explore and interpret data | Universities, institutes, core facilities |
| Drug Developers | Apply insights to pipelines | Pharmaceutical and biotechnology companies, CROs |
Sources: Company press releases, expert interviews, secondary sources, Towards Healthcare database and Towards Healthcare analysts.
The Towards Healthcare Companies Quadrant positions key participants in the biological data visualization market by market strength, reflecting revenue scale, market share and geographic reach, and by innovation and growth strategy, reflecting product portfolio breadth, R&D intensity and partnerships. Positions reflect each company's estimated 2025 biological data visualization revenue and our assessment of its software capability, innovation and integration.
Sources: Company press releases, expert interviews, secondary sources, Towards Healthcare database and Towards Healthcare analysts.
Leaders: Thermo Fisher Scientific, Illumina, QIAGEN Digital Insights, Dotmatics, Danaher, ZEISS and Oxford Instruments combine large visualization revenue with broad, integrated software portfolios.
Innovators: Agilent Technologies, 10x Genomics and Evident bring advanced single-cell, spatial and 3D imaging visualization.
By Technique
By Application
By Deployment Model
By End User
By Region
The biological data visualization market was defined as software platforms and tools used to visualize sequencing, microscopy, magnetic resonance imaging, X-ray crystallography, spectroscopy, and other biological data, deployed on-premises or in the cloud, worldwide. The 2025 base year was built bottom-up from users and licences of biological data visualization software by technique, application, deployment model, end user and region, and average licence and subscription prices, and checked top-down against the software revenues of leading bioinformatics, imaging and scientific software companies.
Segment, regional and company values were allocated from techniques, applications, deployment models, end users and regional activity. Key estimates were verified by cross-checking company disclosures, regulatory and industry data and published third-party estimates, and inputs that could not be reconciled were excluded. All segment, regional and company figures were reconciled to the same 2025 base year, and the 2026–2035 forecast, which applies a constant CAGR from the 2025 base, was recalculated and validated.
Analyst View: The biological data visualization market is a fast-growing software segment that turns rapidly expanding sequencing, imaging and structural data into biological insight. Our estimate links demand to users, licences and prices, so the forecast follows research data growth, pharmaceutical adoption, cloud migration and AI integration. The main upside comes from single-cell, spatial and multi-omics studies, while the main risks are free open-source competition and tight research budgets.