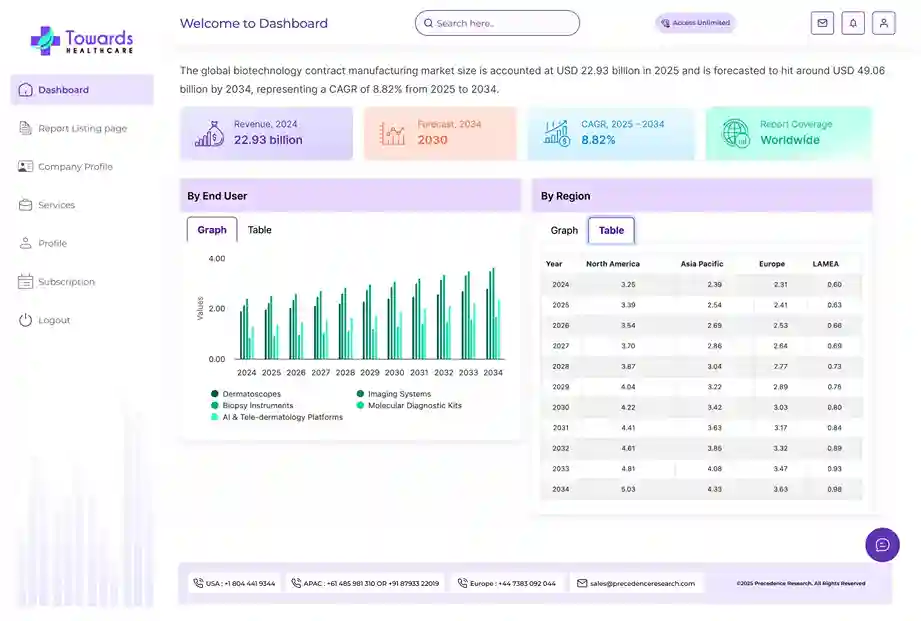
The liver visualization & virtual parenchyma market is forecasted to expand from USD 420 million in 2025 to USD 1400.68 million by 2035, growing at a CAGR of 12.8% from 2026 to 2035. The growing health awareness and liver disease are increasing the use of liver visualization & virtual parenchyma platforms. The growing AI integration, innovations, and launches are also promoting the market growth.
")
The liver visualization & virtual parenchyma market is driven by growing demand for surgical planning, medical imaging, and increasing integration of AI and 3D reconstruction. The liver visualization & virtual parenchyma encompasses advanced imaging and computational technologies used to visualize, analyze, and stimulate the liver. They are also used to identify the liver structure, its blood vessels, functional tissues, and bile ducts, along with the various abnormalities.
AI plays an important role in the liver visualization & virtual parenchyma market, by detecting the liver anatomy and small lesions, offering early detection of liver diseases. It is also used in surgical planning, where its predictive analytics help in reducing the chances of postoperative complications. It is also being integrated with robotic surgeries to reduce surgical errors.
Growing Focus on Real-Time Visualization
To improve the precision on liver anatomy and surgical planning, the augmented reality (AR) and mixed reality (MR) guidance are being integrated with liver visualization & virtual parenchyma platforms.
Flourishing Cloud-Based Platforms
To offer remote care, consultations, and the sharing of data, new cloud-based visualization tools are being developed, which will allow seamless interaction among the specialists and patients.
Increasing Demand for Personalized Treatment Options
Growing demand for personalized treatment options is also increasing the use of liver visualization & virtual parenchyma platforms, which are also being integrated with liver assessment tests.

| Table | Scope |
| Market Size in 2026 | USD 473.76 Million |
| Projected Market Size in 2035 | USD 1400.68 Million |
| CAGR (2026 - 2035) | 12.8% |
| Leading Region | North America by 42% |
| Key Applications | Liver resection planning, liver transplantation planning, tumor localization, embolization planning, vascular territory mapping, volumetric analysis, intraoperative navigation |
| Primary End Users | Hospitals, Academic Medical Centers, Liver Surgery Centers, Transplant Centers, Interventional Radiology Departments |
| Key Challenges | High software costs, workflow integration challenges, regulatory requirements, reimbursement limitations, need for specialized expertise |
| Measurable Values | USD Millions/Units/Volume |
| Market Segmentation | By Technology/Modality, By Clinical Application, By Component/Solution Type, By End-User, By Region |
| Top Key Players | GE HealthCare, Siemens Healthineers, Koninklijke Philips N.V., Fujifilm Holdings Corporation, Canon Medical Systems, TeraRecon, MeVis Medical Solutions AG, Ziosoft, Ceevra, Inc., Innersight Labs |
| Segments | Shares % |
| 3D Liver Visualization & Rendering Platforms | 32% |
| AI-based Liver Parenchyma Modeling & Visualization Software | 24% |
| Virtual Parenchyma Models for Intra-procedure Guidance | 18% |
| Multimodal Image Fusion (CT + MRI + PET) | 16% |
| Virtual Biopsy / Radiomic Visualization Tools | 10% |
Why Did the 3D Liver Visualization & Rendering Platforms Segment Dominate in the Market in 2025?
The 3D liver visualization & rendering platforms segment held the largest share of 32% in the liver visualization & virtual parenchyma market in 2025, due to their accurate anatomical representation. Moreover, their seamless integration with imaging modalities also increased their acceptance rates.
AI-based Liver Parenchyma Modeling & Visualization Software
The AI-based liver parenchyma modeling & visualization software segment is expected to show the highest growth during the upcoming years, due to rapid and accurate results. They also reduce the chances of human errors, which increases their use in the surgical planning of various complex liver diseases.
| Segments | Shares % |
| Surgical Planning & Hepatectomy Simulation | 30% |
| Interventional Radiology Guidance | 24% |
| Liver Tumor Visualization & Resection Planning | 18% |
| Disease Diagnosis & Staging | 16% |
| Radiomic Feature Extraction & Risk Prediction | 12% |
How Surgical Planning & Hepatectomy Simulation Segment Dominated the Market in 2025?
The surgical planning & hepatectomy simulation segment led the liver visualization & virtual parenchyma market by 30% in 2025, due to their enhanced surgical precision. Additionally, their minimally invasive approach and reduction in postoperative complications also increased their adoption rates.
Interventional Radiology Guidance
The interventional radiology guidance segment is expected to show rapid growth during the upcoming years, due to its real-time imaging integration and enhanced process accuracy. Their minimally invasive approach and enhanced safety are increasing their demand, which is increasing their use in the treatment of complex conditions.
| Segments | Shares % |
| Software Platforms (Visualization & Interpretation) | 34% |
| AI & Deep Learning Engines | 24% |
| 3D Rendering & Virtual Parenchyma Tools | 18% |
| Integration & PACS / Enterprise Imaging Solutions | 14% |
| Professional Services & Workflow Support | 10% |
Which Component/Solution Type Segment Held the Dominating Share of the Market in 2025?
The software platforms segment held the dominating share of 34% in the liver visualization & virtual parenchyma market in 2025, as they are essential for 3D visualization and modelling. This increased their use in the surgical planning, where their easy and faster integration with imaging modalities also increased their use.
AI & Deep Learning Engines
The AI & deep learning engines segment is expected to show the highest growth during the predicted time, due to their faster detection of liver abnormalities and high accuracy. Their predictive analytics is also increasing their use in the detection of surgical risk, where their growing advancements are also promoting their innovations.
| Segments | Shares % |
| Hospitals & Radiology Departments | 48% |
| Diagnostic Imaging Centers | 22% |
| Ambulatory Surgery & Interventional Centers | 14% |
| Research & Academic Institutions | 9% |
| Specialist Clinics (Hepatology, Oncology) | 7% |
What Made Hospitals & Radiology Departments the Dominant Segment in the Market in 2025?
The hospitals & radiology departments segment led the liver visualization & virtual parenchyma market by 48% in 2025, due to growth in the patient volume, which increased the use of these platforms. Moreover, their advanced infrastructure and clinical care also attracted patients, increasing their outcomes.
Diagnostic Imaging Centers
The diagnostic imaging centers segment is expected to show rapid growth during the predicted time, due to growing outpatient imaging demand. Furthermore, their focus on preventive care also increased their preferences, where the presence of affordable advanced technologies is also increasing their use.
")
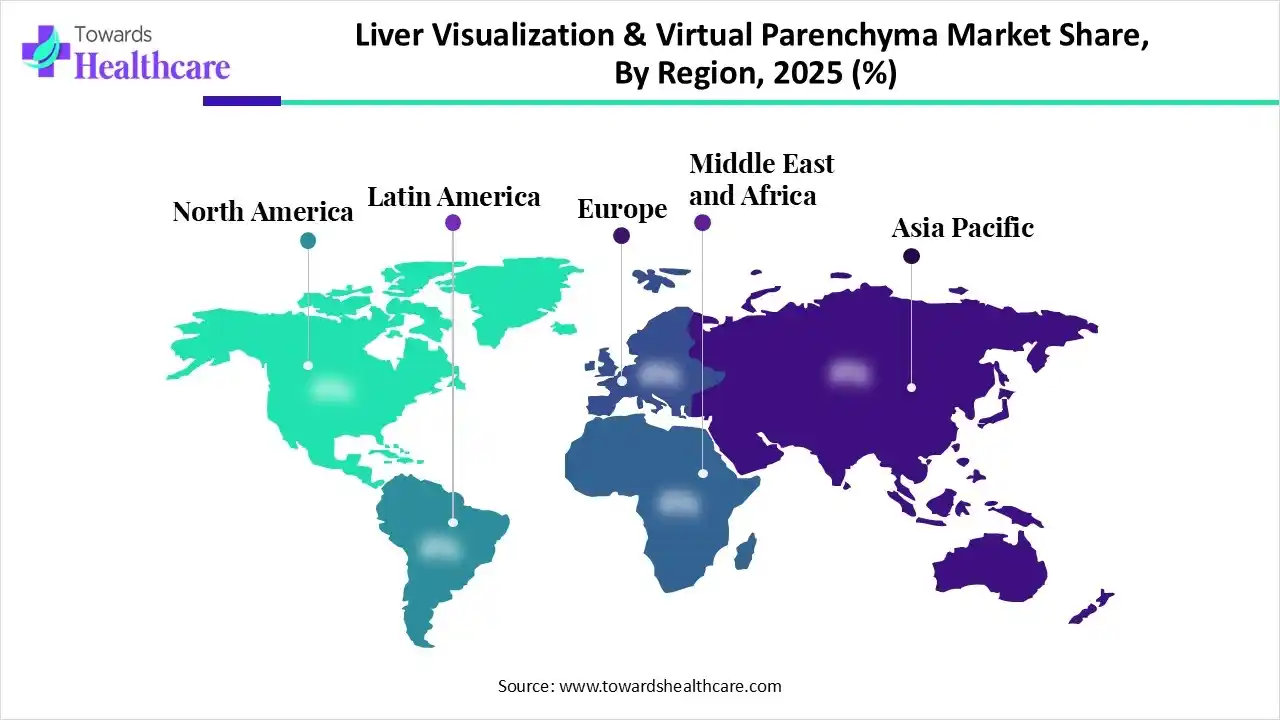
North America dominated the liver visualization & virtual parenchyma market by 42% share in 2025, due to the presence of advanced healthcare, which increased the early adoption of advanced technologies. The growing liver diseases also increase their use, where the presence of reimbursement policies also encouraged their use, which contributed to the market growth.
U.S. Market Trends
The growing early adoption of advanced technologies like liver visualization & virtual parenchyma platforms is driving the market in the U.S. Their growing innovations are also increasing their adoption rates, where the growing investments and liver disease are also increasing their use and acceptance rates.
Asia Pacific is expected to host the fastest-growing liver visualization & virtual parenchyma market by 20% during the forecast period, due to growing liver diseases, which are increasing the demand for their accurate detection and effective treatment, promoting the use of these platforms. The expanding healthcare and growing R&D activities are also increasing their adoption rates and innovations, enhancing the market growth.
China Market Trends
China consists of a large population, which is increasing the incidence of various liver diseases, increasing the demand and adoption of liver visualization and virtual parenchyma platforms. The expanding healthcare and growing government initiatives are also promoting their utilization.
Europe is expected to grow significantly in the liver visualization & virtual parenchyma market share with 26% during the forecast period, due to the presence of a well-developed healthcare system, where the growing skilled personnel are also increasing the use of these platforms to enhance safety and patient outcomes. The growing innovations and shift towards minimally invasive procedures are also promoting the market growth.
UK Market Trends
The UK consists of well-developed liver care centres and advanced healthcare systems, which are also promoting the adoption of liver visualization and virtual parenchyma platforms. The growing R&D activities and technological innovations are also increasing their advancements, encouraging their use.
South America is rapidly growing in the liver visualization and virtual parenchyma market, driven by increasing chronic liver disease cases, healthcare infrastructure investments, and advanced AI imaging technology. Chronic liver diseases are prevalent due to sedentary lifestyles, high alcohol consumption, obesity, and type 2 diabetes (NAFLD), necessitating better non-invasive diagnostic methods. Brazil, Argentina, and Colombia are investing heavily in hospitals and diagnostic centers, enhancing access to MRI, CT, and advanced imaging technologies. There is a rising awareness of the importance of early diagnosis for better treatment outcomes, increasing demand for advanced imaging to detect liver diseases early.
Brazil Market Trends
Brazil is at the forefront of the market, largely due to its high rates of liver diseases that drive the adoption of advanced diagnostic tools. Key factors include significant investments in healthcare infrastructure, greater use of interventional radiology, and innovative technologies like GE HealthCare's Liver ASSIST Virtual Parenchyma. The integration of AI, 3D visualization, and real-time imaging, such as CBCT, enhances the accuracy of interventional radiology. The rising incidence of NASH and HCC underscores the need for advanced imaging for early detection and treatment planning, with Brazilian researchers actively engaged in collaborative studies on liver surgery navigation.
The Middle East and Africa (MEA) region is rapidly growing in the liver visualization and virtual parenchyma market by 5% share, driven by high chronic disease rates, significant healthcare investments, and swift adoption of AI-based imaging technologies. Saudi Arabia and the UAE are at the forefront of this growth due to their ambitious digitalization plans. To address the shortage of skilled radiologists, particularly in remote areas, there is a rising demand for AI-driven automated liver parenchyma segmentation and 3D visualization tools. The region faces high rates of metabolic dysfunction-associated fatty liver disease (MAFLD) and related disorders, necessitating advanced diagnostic tools due to the increasing prevalence of obesity and diabetes.
UAE Market Trends
The UAE leads the market, supported by substantial government investments in AI healthcare, excellent infrastructure in cities like Dubai and Abu Dhabi, and a high incidence of liver-related lifestyle diseases. Advanced imaging technologies, such as AI-enabled MRI and CT, are being rapidly adopted for precise surgical planning, establishing the UAE as a leader in advanced diagnostics. The UAE is also pioneering the use of AI in medical imaging, including automated liver parenchyma analysis, to mitigate the shortage of specialized radiologists and enhance diagnostic speed and accuracy. The presence of high-quality medical centers in Abu Dhabi and Dubai attracts international patients, increasing the demand for sophisticated visualization tools. The high prevalence of liver diseases, driven by diabetes and lifestyle factors, further fuels the need for advanced diagnostic and treatment planning systems, positioning the UAE as a central hub for the GCC and Middle East for rapid deployment of the latest medical technologies.
| Ecosystem Segment | Key Participants | Role in Market |
| Technology Providers | GE HealthCare, Siemens Healthineers, Fujifilm Holdings Corporation | Core imaging, AI segmentation, visualization technologies |
| Product Manufacturers | Canon Medical Systems, Philips | Commercial imaging and visualization solutions |
| Software Vendors | TeraRecon, MeVis Medical Solutions AG, Ziosoft | Dedicated liver analysis and surgical planning software |
| Platform Providers | InferVision, Intrasense | AI-powered visualization and workflow platforms |
| Service Providers | MeVis Medical Solutions AG | Remote 3D visualization and planning services |
| Research Institutions | Fraunhofer MEVIS, Ankara University | Algorithm development and clinical validation |
| End-User Industries | Hospitals, Transplant Centers, Academic Research Institutes, Oncology Centers | Clinical adoption and utilization |
R&D
Clinical Trials and Regulatory Approvals
Patient Support and Services

| Tier 1 | Tier 2 | Tier 3 | |
| Typical Market Influence | 68% | 24% | 8% |
| Tier 1 | ||||
| Company Name | Headquarters | Country | Why Relevant to This Market | Key Products/Services |
| GE HealthCare | Chicago, Illinois | USA | Leading interventional imaging and virtual parenchyma solutions | Liver ASSIST Virtual Parenchyma |
| Siemens Healthineers | Erlangen, Bavaria | Germany | Strong global presence in advanced liver analysis | syngo.via Frontier, syngo.CT Liver Analysis |
| Philips | Amsterdam | Netherlands | Major imaging informatics and visualization provider | IntelliSpace Portal |
| Tier 2 | ||||
| Company Name | Headquarters | Country | Why Relevant to This Market | Key Products/Services |
| TeraRecon | Durham, North Carolina | USA | Advanced visualization leader with strong hospital adoption | TeraRecon AV |
| MeVis Medical Solutions AG | Bremen | Germany | Dedicated liver planning and virtual resection expertise | MeVis Liver Suite, MeVis Distant Services |
| Ziosoft | Tokyo | Japan | Specialized 3D medical imaging software | Ziostation2 |
| Tier 3 | ||||
| Company Name | Headquarters | Country | Why Relevant to This Market | Key Products/Services |
| Ceevra, Inc. | Ann Arbor, Michigan | USA | 3D anatomical visualization innovator | Ceevra Reveal |
| Innersight Labs | London, England | UK | Surgical planning and 3D visualization startup | Innersight3D |
| LiverVision | Ankara | Türkiye | Specialized liver volumetry and visualization platform | LiverVision |
Strengths
Weaknesses
Opportunities
Threats
By Technology/Modality
By Clinical Application
By Component/Solution Type
By End-User
By Region


Principal Consultant
Shivani Zoting is a dedicated research analyst specializing in the healthcare industry. With a strong academic foundation, a B.Sc. in Biotechnology and an MBA in Pharmabiotechnology, she brings a unique blend of scientific understanding and strategy.
Learn more about Shivani Zoting
Reviewed By
Aditi Shivarkar is a seasoned professional with over 14 years of experience in healthcare market research. As a content reviewer, Aditi ensures the quality and accuracy of all market insights and data presented by the research team.
Learn more about Aditi Shivarkar