
Pipeline Programs

CGT Companies Tracked

Manufacturing Facilities


The North America clinical proteomics market size was estimated at USD 175.6 million in 2025 and is predicted to increase from USD 198.08 million in 2026 to approximately USD 585.62 million by 2035, expanding at a CAGR of 12.8% from 2026 to 2035. Her analysis highlights that the North America clinical proteomics market is rapidly expanding due to expanding proteomics applications, increasing acquisitions, advancements in biomarker discoveries, rising CRO collaborations, technological advancements, and the presence of key industry players like Illumina, Inc., Standard BioTools Inc., and SomaLogic, Inc.
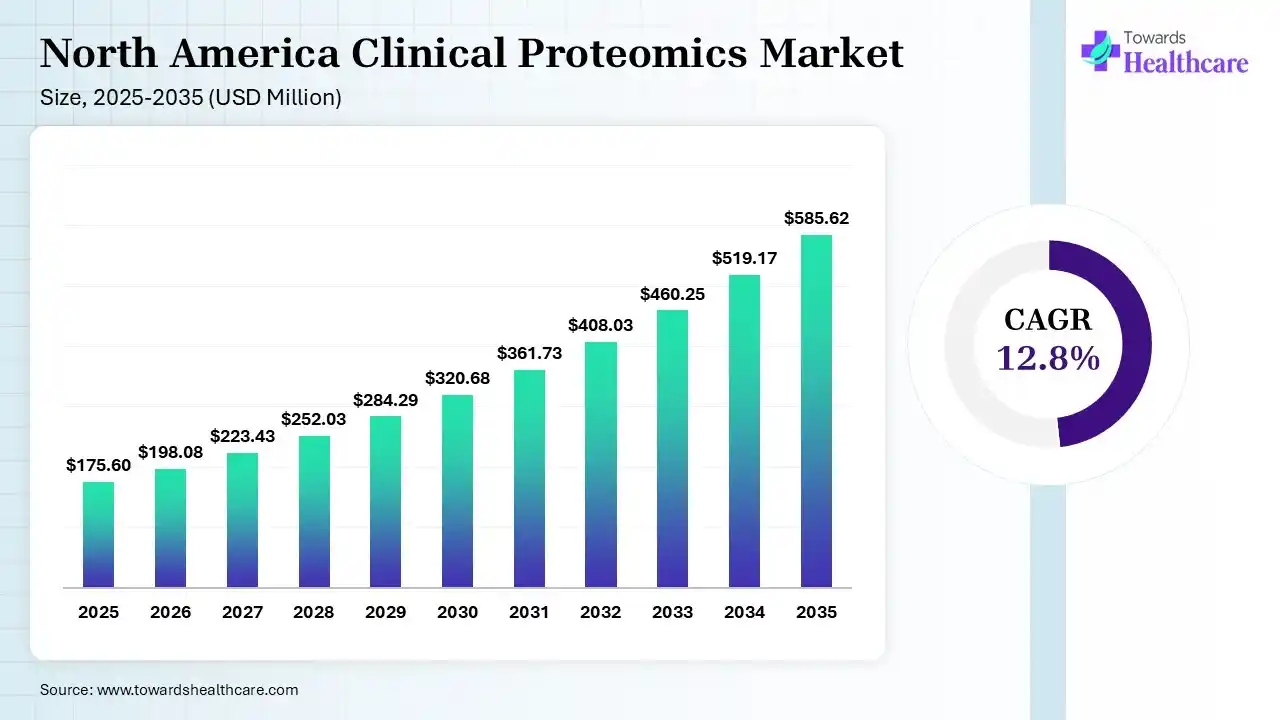
North America clinical proteomics refers to the use of biological samples like blood, tissues, and cerebrospinal fluid for the analysis of proteins, post-translational modifications, and protein variants across North American patients. These include protein-analysis technologies like mass spectrometry, ultrasensitive digital immunoassays, mass cytometry, affinity-based assays, single-molecule protein sequencing, and spatial proteomics. They help in biomarker discovery, precision medicine, clinical diagnosis, treatment monitoring, and patient stratification. Moreover, the technologies, products, applications, clinical use, samples, workflow, and end users, along with the TAM-SAM-SOM opportunity model, companies, and buyer intelligence, are covered in this report.
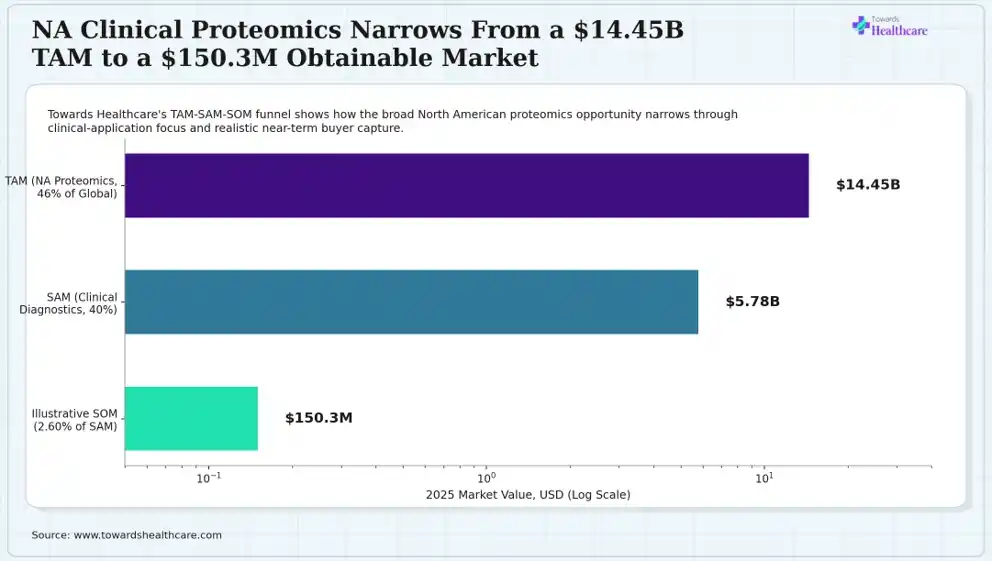
As the market research analyst, I interpret that the horizontal funnel chart (log scale) illustrates TAM-SAM-SOM value by layer. The TAM value in 2025 was noted to be $14.45 billion, where its global proteomics market was noted to be $31.42B and held a 46% North American share. SAM contributed to NA TAM × 40% clinical diagnostics application share, which accounted for a $5.78 billion 2025 value. Illustrative SOM highlighted 2.60% modeled capture of SAM across 4 priority buyer groups and held $150.3 million in 2025 value.
Key Insight:
A noteworthy gap between the full regional proteomics ecosystem and the realistic near-term revenue as a single market entrant was represented by a 96-fold narrowing from TAM to illustrative SOM, which can be captured across priority clinical buyer segments.
Source: Towards Healthcare, North America Clinical Proteomics Market Model, 2025.
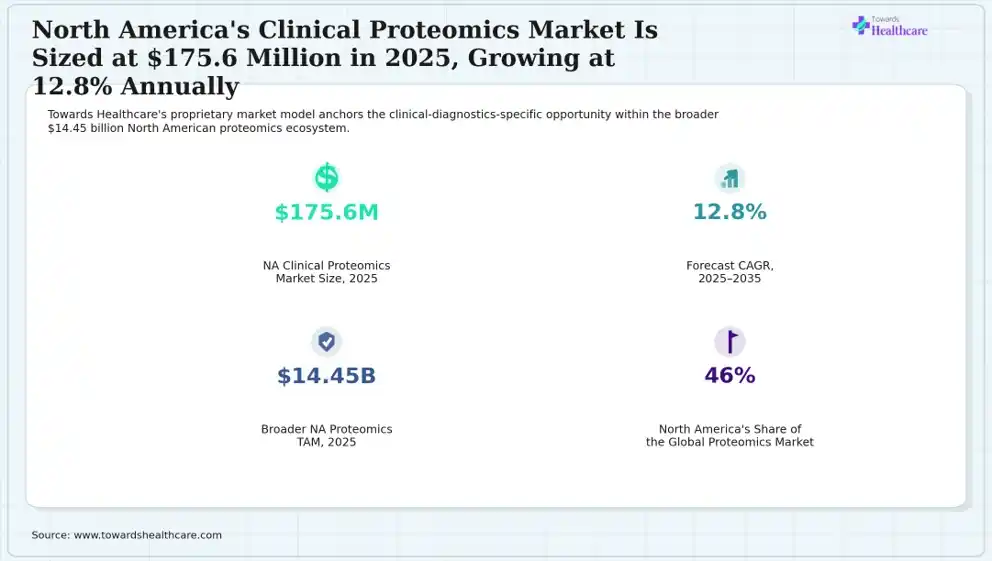
The given infographic stat panel covers market definition and sizing metrics. In 2025, the NA clinical proteomics market size was recorded to be $175.6 million, while the broader NA proteomics TAM was $14.45 billion. North America's share was reported to be 46% of the global proteomics market, while the 2025-2035 forecast CAGR is expected to be 12.8%.
Key Insight:
NA clinical proteomics contributes $175.6 million as a focused sub-segment of the much larger $14.45 billion regional proteomics TAM, highlighting that the clinically applied portion of the substantially broader research and discovery market is addressed by this section.
Source: Towards Healthcare, North America Clinical Proteomics Market Model, 2025.
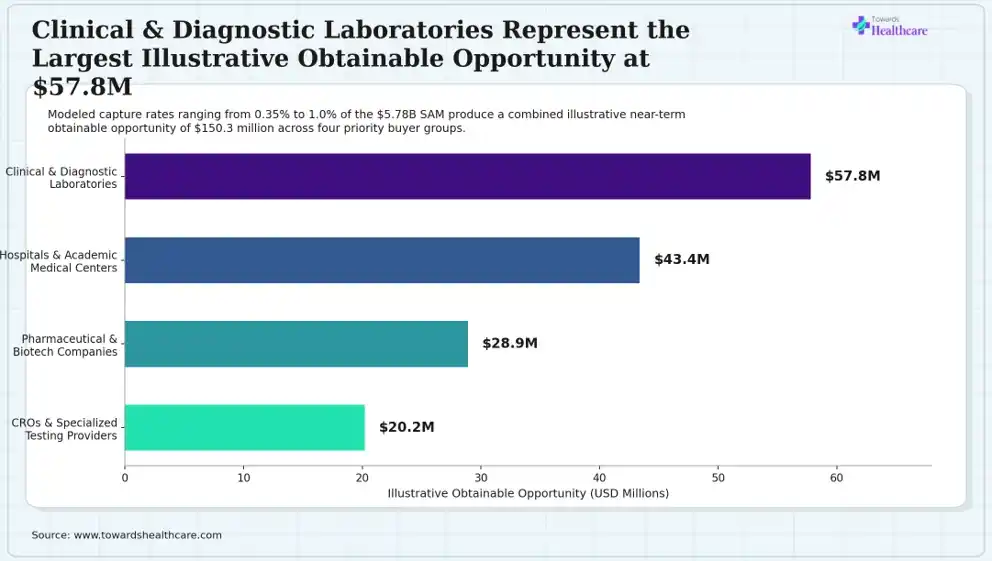
Based on our research, the horizontal bar chart represents illustrative SOM opportunity by buyer segment. The clinical & diagnostic laboratories held a 1.0% illustrative capture rate, with $57.8 million implied opportunity. The hospitals & academic medical centers contributed to 0.75% illustrative capture rate and $43.4 million implied opportunity, while 0.50% illustrative capture rate and $28.9 million implied opportunity was held by pharmaceutical & biotechnology companies. Similarly, CROs & specialized testing providers accounted for a 0.35% illustrative capture rate and $20.2 million implied opportunity.
Key Insight:
The growing clinical and diagnostic laboratories' illustrative capture rate indicates higher testing volume and more transactional purchasing relationships with proteomics vendors in comparison to longer, more relationship-driven sales cycles typical of pharmaceutical and CRO accounts.
Source: Towards Healthcare, North America Clinical Proteomics Market Model, 2025 (illustrative capture scenarios, not published market-share observations).
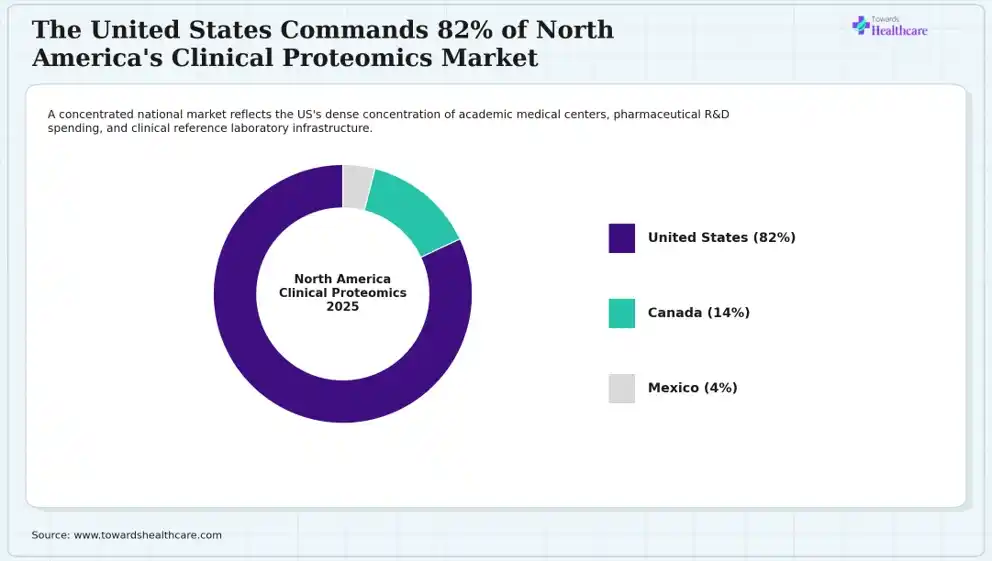
The above-mentioned donut chart highlights North America clinical proteomics market share by country. The U.S. held the highest share of 82% of the NA clinical proteomics market in 2025. Canada, on the other hand, held the second-largest share of 14%, while 4% share was held by Mexico.
Key Insight:
The higher concentration of NIH-funded proteomics core facilities, CLIA-certified reference laboratories, and major pharmaceutical R&D campuses compared to Canada and Mexico in the U.S. contributed to its 82% share of the market.
Source: Towards Healthcare, North America Clinical Proteomics Market Model, 2025.
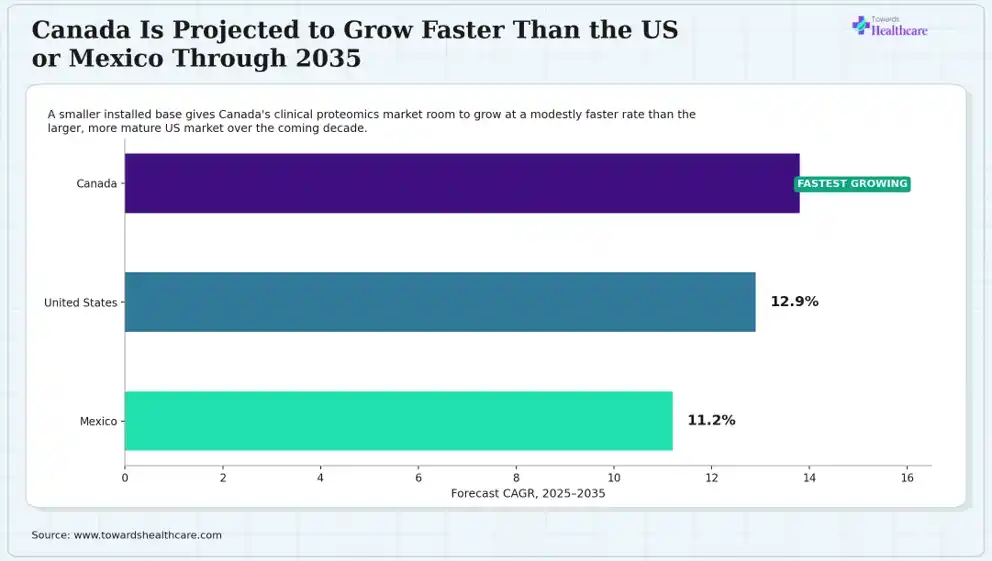
As per the analysis conducted by Aman, the horizontal bar chart reflects a North American country-level CAGR comparison. Canada is expected to grow with the highest CAGR of 13.8% during 2025-2035. The U.S. is expected to expand significantly with 12.9%, while Mexico is anticipated to grow lucratively with 11.2% during 2025-2035.
Key Insight:
The incremental adoption leading to proportionally larger percentage gains, despite the smaller current market size, with a consistent smaller-base effect common in maturing technology markets, is driving Canada's faster projected growth rate.
Source: Towards Healthcare, North America Clinical Proteomics Market Model, 2025.
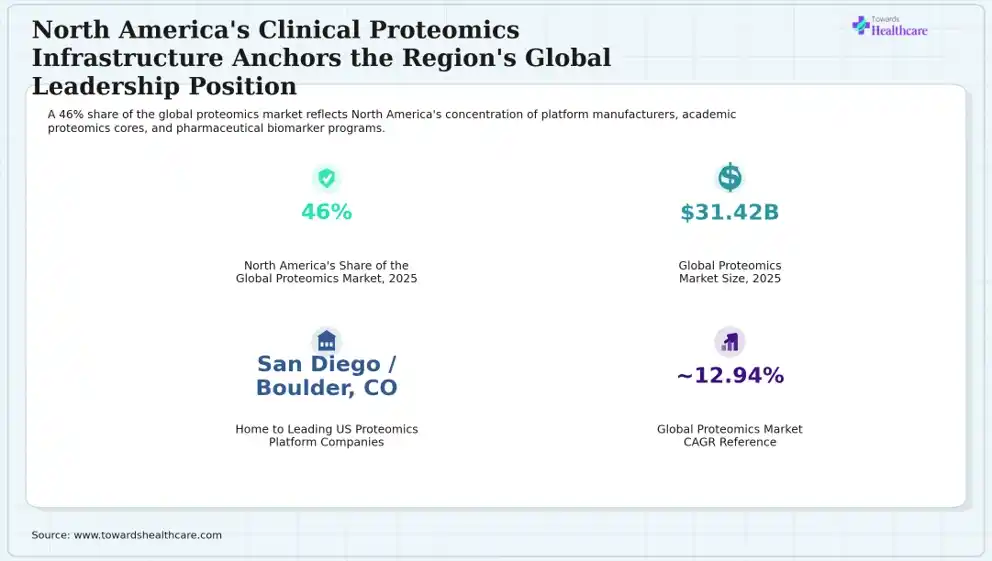
Based on the information gathered, the infographic stat panel covers North America global market positioning metrics. In 2025, the global proteomics market size was noted to be $31.42 billion, while it is expected to expand by approximately 12.94% during the forecast period. North America's share of the global proteomics market was noted to be 46%, where it is home to leading U.S. proteomics platform companies across San Diego, CA/Boulder, CO.
Key Insight:
North America's growth trajectory appears representative of, rather than a deviation from, the global technology adoption curve, which is promoting North America's clinical proteomics market (CAGR 12.8%) and tracing the global proteomics market's growth rate (~12.94%).
Source: Towards Healthcare, North America Clinical Proteomics Market Model, 2025.
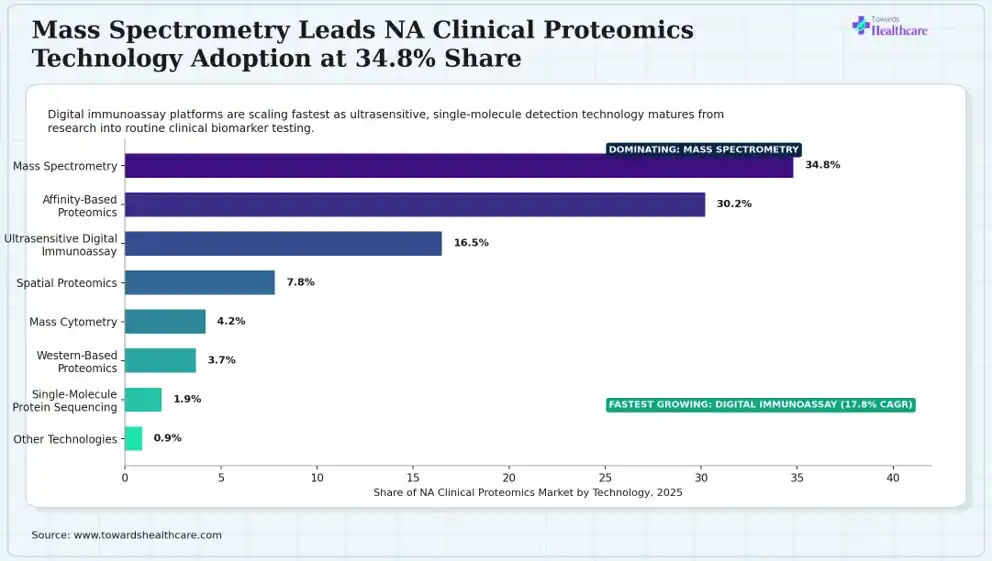
According to the survey conducted, the horizontal bar chart represents the NA clinical proteomics market share by technology in 2025. Based on the technology type, the mass spectrometry segment dominated the market with 34.8%, while the affinity-based proteomics segment held the second-largest share of 30.2%. The ultrasensitive digital immunoassay is expected to show the fastest growth with 17.8% CAGR during the forecast period, while the spatial proteomics segment held a 7.8% share in 2025 and is expected to expand with 18.6% CAGR during the predicted period. The mass cytometry segment contributed 4.2% market share, while the western-based proteomics segment reported 3.7% market share. The single-molecule protein sequencing segment held 1.9% share and is expected to grow significantly with 24.5% CAGR in upcoming years, whereas the other technologies held 0.9% share in 2025.
Key Insight:
Mass spectrometry and affinity-based proteomics together account for 65%, dominating the market, while emerging technology categories like digital immunoassay, spatial proteomics, and single-molecule sequencing, accounting for 17.8%-24.5% CAGR, are expected to drive the market growth at double the overall market rate.
Source: Towards Healthcare, North America Clinical Proteomics Market Model, 2025.
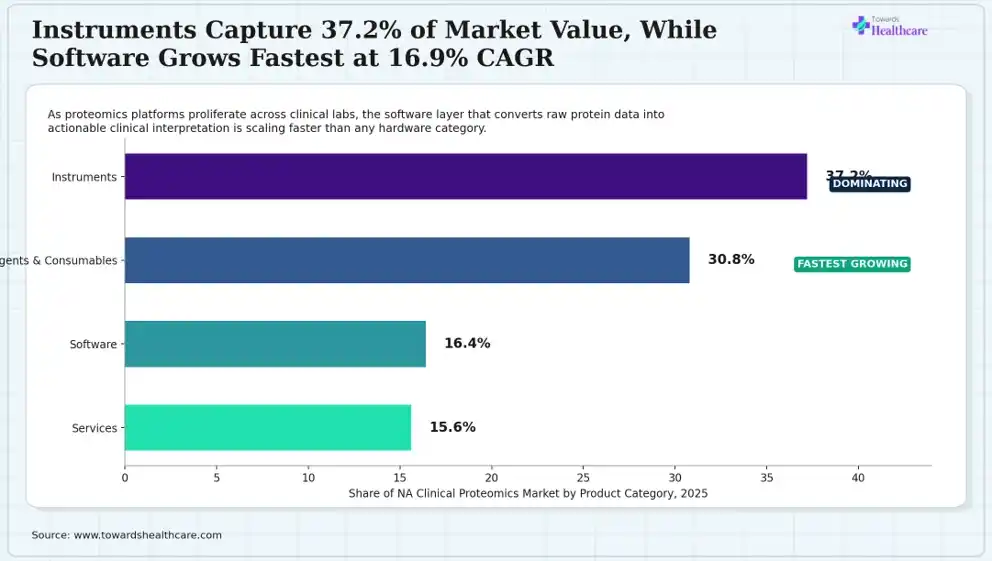
As the market research analyst, I interpret that the horizontal bar chart outlines the NA clinical proteomics market share by product category in 2025. Based on the product category, the instruments segment held the highest share of 37.2% of the market in 2025, while the reagents & consumables segment held the second-largest share of 30.8%. Furthermore, the software segment accounted for 16.4% market share and is expected to expand rapidly at a 16.9% CAGR during the predicted period. The services segment held a 15.6% share in 2025.
Key Insight:
A structural shift visible in adjacent genomics markets, along with growing demand for a data-interpretation layer, captures a growing share of incremental value, propelling the software’s fastest growth despite its smallest current share while the instrument installed base begins to mature.
Source: Towards Healthcare, North America Clinical Proteomics Market Model, 2025.
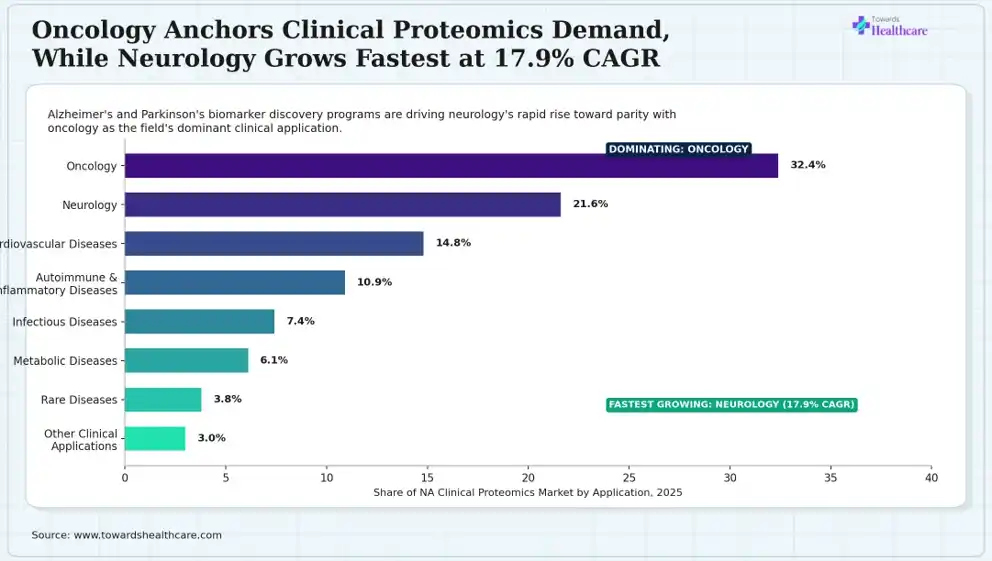
The given horizontal bar chart compares NA clinical proteomics market share by clinical application in 2025. As per the clinical applications, the oncology segment held the largest share of 32.4% of the market in 2025, with a 13.1% CAGR during the forecast period. The neurology segment held the second-largest share of 21.6% and is expected to grow with the highest CAGR of 17.9% during the predicted period. The cardiovascular diseases segment held a 14.8% share, while the autoimmune & inflammatory diseases segment held a 10.9% share. The infectious diseases segment contributed to 7.4% market share, while the metabolic diseases segment accounted for 6.1% of the market share. The rare diseases segment held a 3.8% share, while the other clinical applications segment accounted for a 3.0% market share in 2025.
Key Insight:
With a 17.9% CAGR growth rate of neurology compared to oncology's 13.1%, the category could dominate the market meaningfully within the ten-year forecast window, making neurodegenerative disease biomarker programs the central growth driver for the category.
Source: Towards Healthcare, North America Clinical Proteomics Market Model, 2025.
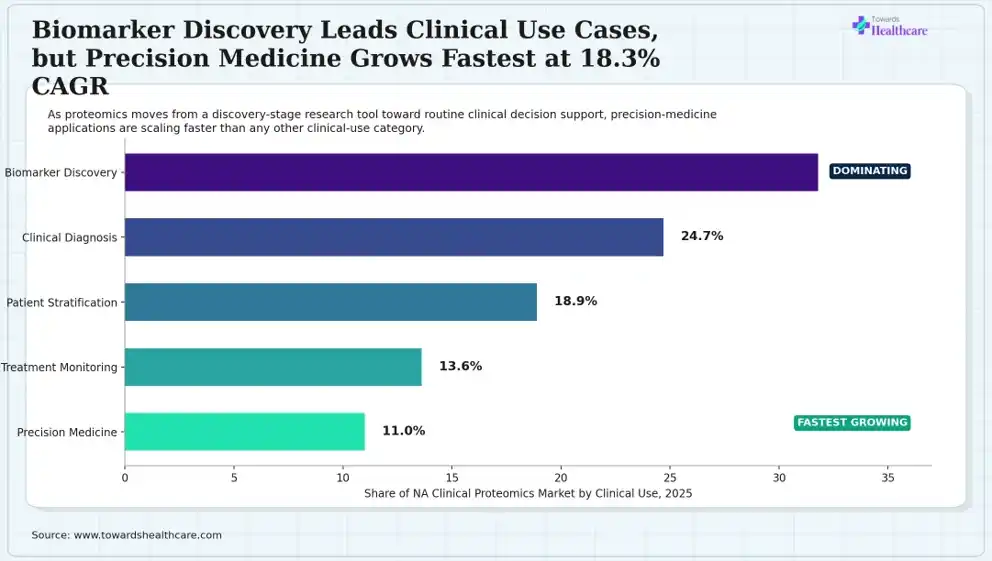
As per the analysis, the horizontal bar chart reflects the NA clinical proteomics market share by clinical use in 2025. According to clinical use types, the biomarker discovery segment registered dominance with 31.8% and is expected to grow significantly with 13.7% CAGR during the predicted period. The clinical diagnosis segment held the second-largest share of 24.7% and is anticipated to grow with 15.6% CAGR. The patient stratification segment held 18.9% and is expected to expand rapidly with 16.2% CAGR during the forecast period. The treatment monitoring segment held 13.6% market share and is anticipated to grow at 15.8% CAGR in the near future. Furthermore, the precision medicine segment contributed 11% market share in 2025 and is expected to grow at 18.3% CAGR in the upcoming years.
Key Insight:
The rapid expansion of all four non-discovery clinical-use categories compared to biomarker discovery itself indicates that the market is shifting from upstream research applications toward downstream clinical decision-making use cases.
Source: Towards Healthcare, North America Clinical Proteomics Market Model, 2025.
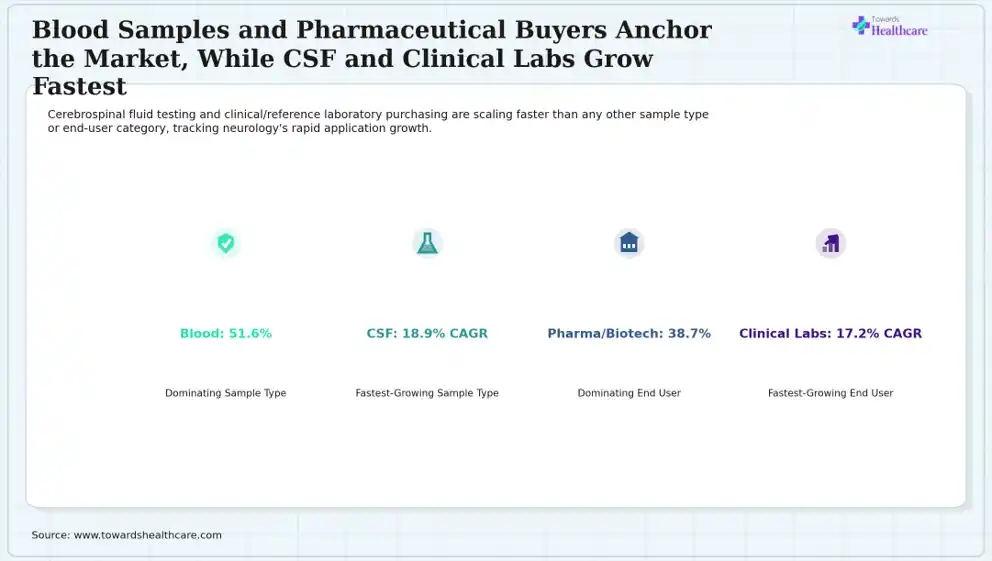
The above-mentioned ecosystem infographic encompasses sample type and end-user segment leaders. By sample type, the blood segment dominated the market with a 51.6% share, while the cerebrospinal fluid segment is expected to show the highest growth with 18.9% CAGR during the predicted period. As per the end-user, the pharmaceutical & biotechnology companies segment registered dominance with a 38.7% share in 2025, whereas the clinical & reference laboratories segment is anticipated to expand rapidly with 17.2% CAGR during the upcoming years.
Key Insight:
The rapid growth of cerebrospinal fluid sample type among the others reflects neurology's fastest-growing status among applications, which confirms that the growing neurodegenerative disease biomarker programs are fueling these two segment dimensions.
Source: Towards Healthcare, North America Clinical Proteomics Market Model, 2025.
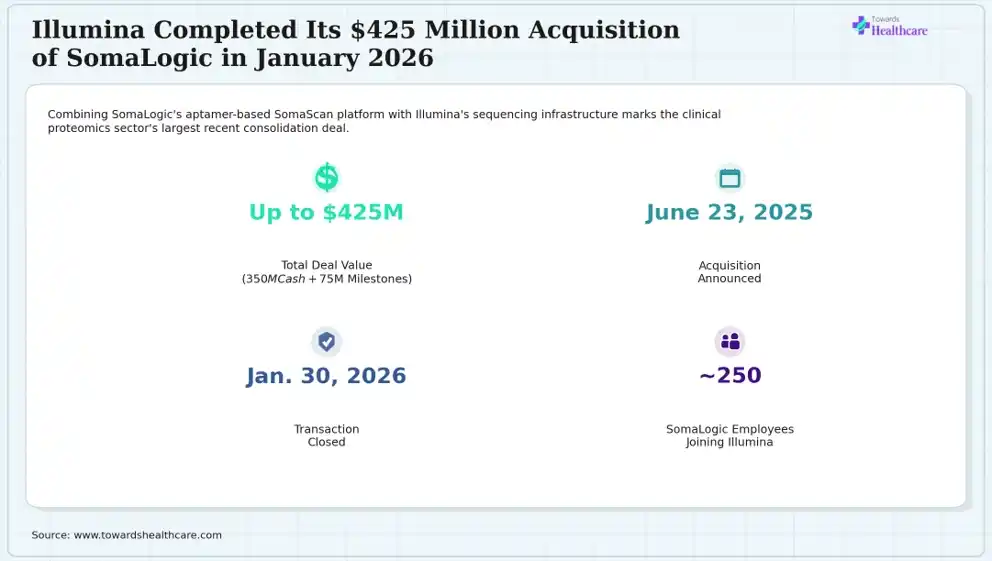
Based on the research conducted by Aman, the infographic stat panel focuses on Illumina-SomaLogic acquisition metrics. The acquisition was announced on June 23, 2025, with a total deal value of up to $425 million ($350M cash + $75M milestones), and the transaction was closed on January 30, 2026, resulting in approximately 250 SomaLogic employees joining Illumina.
Key Insight:
The merging of SomaLogic with Standard BioTools in 2023, followed by its 2025-2026 divestiture to Illumina, reflects the expanding ownership of leading affinity-based proteomics platforms, which is combining across the large-scale sequencing and multiomics infrastructure companies.
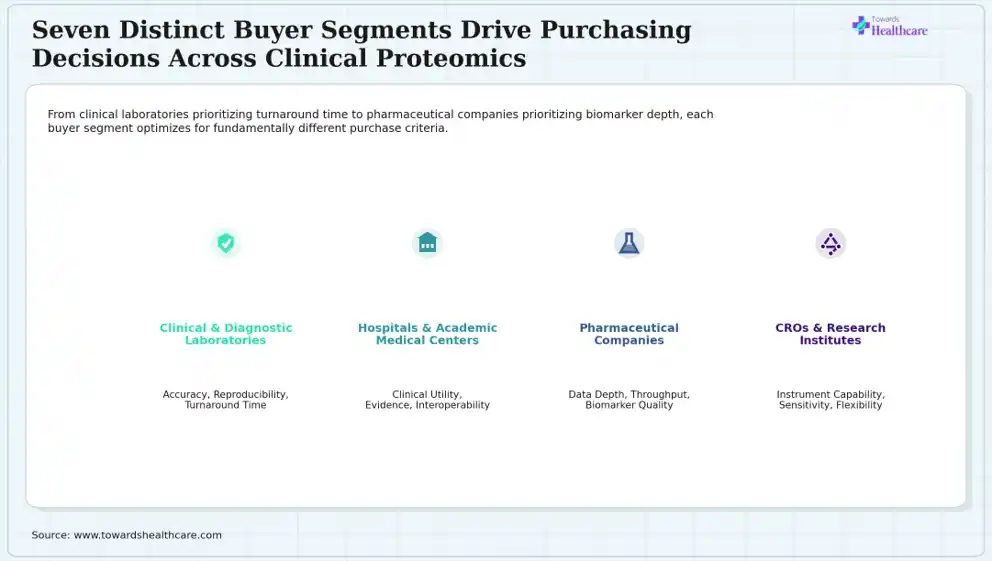
According to the information gathered by Aman, the ecosystem infographic covers four representative clinical proteomics buyer segments. Based on buyer types, the clinical & diagnostic laboratories segment's key purchase drivers are accuracy, reproducibility, turnaround time, and workflow integration, while the hospitals & academic medical centers segment considers clinical utility, evidence, interoperability, and total cost as important aspects. The pharmaceutical companies segment focuses on data depth, throughput, biomarker quality, and scalability, whereas the CROs & research institutes segment is driven by instrument capability, sensitivity, and technology flexibility.
Key Insight:
The different operational and scientific priorities of laboratory buyers (turnaround time, workflow integration) and pharmaceutical buyers (biomarker quality, data depth) suggest that it is essential to focus on fundamentally different value propositions among vendors to win each segment.
Source: Towards Healthcare, North America Clinical Proteomics Buyer Intelligence, 2025.
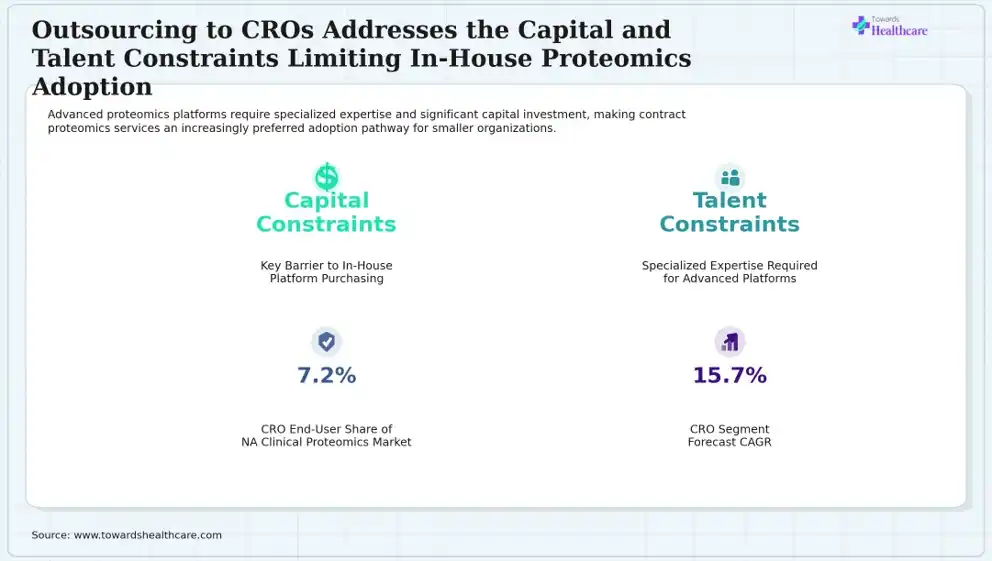
As the market research analyst, I interpret that the infographic stat-panel focus on outsourcing and CRO adoption behavior metrics. Capital constraints are the key barrier to in-house platform purchasing, while talent/specialized expertise constraints are the key barrier to in-house platform operation. The CRO end-user held a 7.2% share of the NA clinical proteomics market and is expected to grow with a CAGR of 15.7% during the forecast period.
Key Insight:
The rising disproportionate shares of new markets, consistent with the capital and talent barriers across smaller organizations building in-house capability, are driving the CRO segment growth with 15.7%, contributing to approximately 3 percentage points faster than the overall 12.8% market CAGR.
Source: Towards Healthcare, North America Clinical Proteomics Market Model & Consumer Behavior Intelligence, 2025.
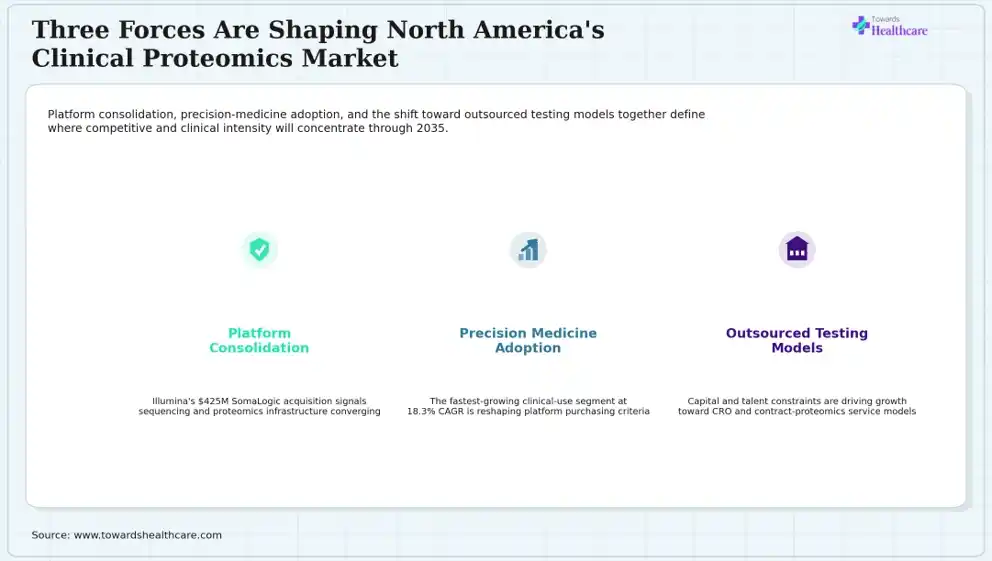
As per the survey conducted by Aman, the synthesis infographic illustrates three structural forces shaping NA clinical proteomics competition. The platform consolidation focuses on Illumina's $425M SomaLogic acquisition, reflecting sequencing and proteomics infrastructure converging. The precision medicine adoption highlights that the fastest-growing clinical-use segment at 18.3% CAGR is reshaping platform purchasing criteria. Outsourced testing models point to capital and talent constraints, promoting growth toward CRO and contract proteomics service models.
Key Insight:
The platform consolidation (Illumina-SomaLogic) supports building the scaled infrastructure essential to address precision medicine's growing clinical demand, where the participation of capital- and talent-constrained buyers in the same demand growth is backed by CROs providing the access layer, which in turn underpins these three forces.
In October, 2023, a collaboration between Standard BioTools and SomaLogic, which resulted in combining mass cytometry and microfluidics capabilities with combining aptamer-based affinity proteomics under one corporate parent.
Source: GenEngNews, June 2025
In late 2021, to introduce the SomaScan Proteomics Assay onto high-throughput next-generation-sequencing platforms of Illumina, a co-development partnership between SomaLogic and Illumina was announced.
Source: Illumina press release, June 2025
On June 23, 2025, a definitive agreement to acquire SomaLogic and related assets for up to $425 million from Standard BioTools while maintaining its mass cytometry and microfluidics businesses was announced by Illumina.
Source: GenEngNews; Illumina press release, June 2025
In Q3 2025, Illumina Protein Prep, now rebranded as Illumina SomaSeq Discovery, was made available to all customers, which contributed to approximately 40 early-access customers worldwide.
Source: Illumina press release, June 2025
On January 30, 2026, a successful acquisition of SomaLogic, promoting the integration of its proteomics platform and nearly 250 employees into Illumina's multiomics portfolio, was announced by Illumina.
Source: Illumina, “Illumina completes acquisition of SomaLogic,” Jan. 2026
It is an acquirer/platform consolidator that acquired SomaLogic for up to $425M on 30 January 2026, integrating a multiomics portfolio.
It is a seller/divesting parent, which divested SomaLogic and Sengenics while retaining mass cytometry (CyTOF) and microfluidics businesses.
It is an acquired platform company consisting of the aptamer-based SomaScan platform, with approximately 250 employees, which merged into Standard BioTools in 2023-2024 and was later acquired by Illumina.
Aditi is a life science research expert with strong experience in analytical technologies, clinical testing, and biomarker development programs. She conducted detailed market research, analyzed company data, clinical trends, and industry developments. Based on her comprehensive analysis, the following strategic key takeaways highlight the most important market insights and opportunities.
For Service Providers & CDMOs
For Pharma & Biotech Companies
For Investors & Corporate Strategy Teams
Based on my assessment, the market is expanding rapidly due to growing applications and biomarker development programs. The growth in clinical activities are also increasing the demand for specialized testing technologies. I also anticipate that the new collaboration among the major companies can enhance access to their services as well as accelerate innovations. I also see strong growth in ultrasensitive digital immunoassays and multiplex assays, which will create new market opportunities.
Payal Rabde led the primary market research, developed the methodology, analyzed trends, segmentation, competition, forecasts, and strategic opportunities, forming the report's analytical foundation.
Aman was responsible for collecting and validating clinical trial data, research publications, company information, partnerships, and other quantitative datasets, strengthening evidence-based analysis and market estimations.
Aditi reviewed the complete research document, performed quality checks, validated findings, refined content, corrected inconsistencies, and finalized the report, ensuring accuracy, clarity, credibility, and publication-ready quality.
By Technology
By Product
By Application
By Clinical Use
By Sample Type
By End User
By Workflow
By Region

















Principal Consultant
Payal Rabde is a Healthcare Market Research Analyst at Towards Healthcare Research & Consulting with 4+ years of experience in pharmaceuticals, biotechnology, medical devices, and life sciences.
Learn more about Payal Rabde

Reviewed By
Aditi Shivarkar is a seasoned professional with over 14 years of experience in healthcare market research. As a content reviewer, Aditi ensures the quality and accuracy of all market insights and data presented by the research team.
Learn more about Aditi Shivarkar