
Pipeline Programs

CGT Companies Tracked

Manufacturing Facilities


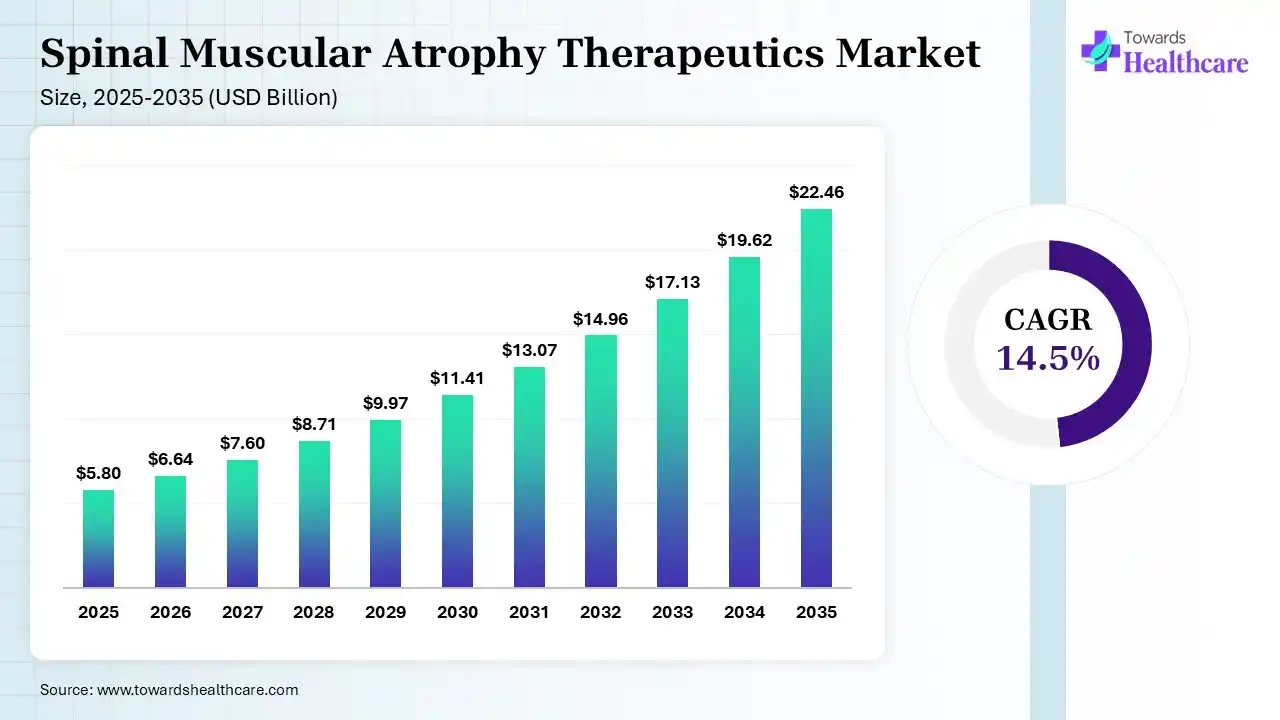
The global spinal muscular atrophy therapeutics market is estimated to reach USD 6.64 billion in 2026. The market is projected to grow to USD 22.46 billion by 2035, at a CAGR of 14.5% during the 2026-2035 forecast period. Growth is driven by advances in disease-modifying therapies, earlier diagnosis, and improved access to treatment.
North America remains the largest established revenue market, accounting for an estimated 68.5% of global revenue in 2025. Asia Pacific offers growth opportunities as newborn screening, diagnosis, specialist access, and reimbursement improve. Type 1 SMA contributes a significant share of treatment revenue because of disease severity, the need for early intervention, and high treatment costs.
The global spinal muscular atrophy therapeutics market is moving into a new era of market development, shifting from a market concentrated on three disease-modifying drugs to an overall ecosystem that will include pre-symptom treatment, life-long disease management, increased gene therapy access, as well as additional therapies that will address muscle performance. Key features of the market include the small number of patients, large expenditures per patient, and considerable differences in terms of patient eligibility criteria, delivery logistics, and reimbursements.
The market is built around three main treatment approaches: intrathecal antisense oligonucleotides, oral SMN2 splicing modifiers, and systemic gene replacement therapy. Expanding treatment indications for older children and adults could further increase the number of eligible patients beyond the infant population.
Market growth depends on more than the number of diagnosed patients. Early diagnosis, treatment eligibility, therapy selection, treatment switching, and reimbursement coverage all influence how many patients receive treatment and how much revenue the market generates.
The spinal muscular atrophy therapeutics market is segmented by SMA type, treatment modality, route of administration, patient age, treatment stage, and geography. Type 1 SMA accounts for approximately 63% of market revenue, reflecting the high treatment costs and urgent need for intervention in this severe form of the disease. However, revenue share does not reflect patient share. Older patients and those with less severe forms of SMA may represent a larger proportion of the treated population while accounting for a smaller share of total revenue.
The fastest-growing segment will depend on treatment adoption, pricing, and clinical outcomes. Oral therapies may benefit from easier administration and long-term use, while gene therapies can generate substantial revenue from a small number of patients because of their high upfront cost. Muscle-targeted therapies could create a new premium segment if clinical trials demonstrate meaningful benefits beyond existing SMN-targeted treatments.
Spinal muscular atrophy (SMA) is a rare neuromuscular disorder caused by pathogenic variants in both copies of the SMN1 gene. In the United States, an estimated one in 14,694 births is affected by SMA, resulting in a relatively small patient population. Early diagnosis is important because treatment before significant motor neuron loss can improve clinical outcomes. Disease prevalence varies by population, screening practices, and case identification methods.
According to our analysis, earlier diagnosis is very important from the clinical and commercial perspectives. Early diagnosis allows treatment before losing many motor neurons. On the other hand, the symptoms' patients can be functionally impaired and they require more help. We expect that the trend towards earlier treatment via broad screening and fast diagnostics will increase. Also, longer life expectancy will increase the importance of treatment access for the kids, teens, and adults.
In our opinion, the key market distinction is between the total number of potential patients and those who can access treatment. Countries with established newborn screening programs, genetic testing, and reimbursement systems are better positioned to convert diagnoses into treatment starts. In countries with limited screening, specialist access, or treatment coverage, many patients may remain untreated despite an underlying need for therapy.
Market growth will increasingly depend on improving diagnosis, expanding treatment access, and addressing affordability and reimbursement barriers. These factors are particularly important for newborns and young children, as well as emerging healthcare markets where access to SMA treatment remains limited.
The complete report encompasses the patient funnel from birth rate and disease prevalence at the initial stage to screening, diagnosis, clinical eligibility, reimbursement authorization, and initiation of treatment at the end stage. This report analyzes the diagnosed and undiagnosed patient populations, treatment adoption rate, and accessibility of treatment through geography, SMA categories, age group, and condition of the disease where data is available. A structured database on the subject of epidemiology and patient accessibility could be added to this report to track prevalence rate by country, screening rate, diagnosis rate, eligible patient population, treatment adoption rate, and annual trends.
Price structures for SMA treatments are completely distinct from each other. The historical U.S. list price for a one-off treatment through gene replacement has been around USD 2.1 million, while ongoing medication therapies cost annually depending on dosage, patient’s weight, load regimen, location, and payor agreement. List prices do not mean net prices; secret rebates, purchases, assistance programs, and performance-based arrangements could dramatically affect revenues for pharmaceutical companies.
The process of pricing includes an evaluation of upfront costs against lifetime costs of chronic treatments. This assessment compares the lifetime economic impact of chronic dosing to that of upfront expenses on gene treatment, taking into account the indirect costs, additional care, and efficacy of treatment.
SMA therapeutics supply depends on manufacturing capacity, quality control, product release, distribution, and reimbursement access. Gene therapies require specialized viral vector manufacturing and stringent quality testing. Antisense oligonucleotides also involve complex manufacturing processes, while small-molecule drugs require consistent production and quality control.
Shortages of raw materials, limited manufacturing capacity, production delays, distribution constraints, and delayed market entry in individual countries can affect treatment availability. These factors influence the balance between supply and demand, even when the overall patient population and treatment requirements are relatively well defined. Reliable supply therefore depends on manufacturing consistency, timely product distribution, and healthcare system access.
The value chain comprises the entire process of discovery and development through regulatory approval, specialized manufacturing, market access, distribution, and clinical monitoring. The therapies that hold promise of creating considerable commercial value are distinguished by their unique clinical characteristics, intellectual property protection, and reimbursement.
The economic model of the therapy becomes difficult because not only the cost of production but also research and development costs, trial-and-error approach, regulation, monitoring, and low target population become responsible for that. Distribution, although it may not be considered a significant driver in comparison with volume-based therapies, is nevertheless important for the center and patient.
The SMA therapeutics market is moving from the current methods used for the restoration of the survival motor neuron (SMN) protein generation via the SMN1 gene replacement and SMN2 splicing modification to different methods for the treatment of the disease. Some of those methods include developing new drugs that would affect the course of the disease positively by enhancing muscle function and decreasing the leftover impact of the disease. Itvisma, the onasemnogene abeparvovec gene-therapy drug developed for treating SMA patients aged two years or older who have the SMN1 gene mutation, received FDA approval in November 2025. The current approval shows a chance of developing gene therapy for the treatment of other diseases besides infantile SMA. However, different jurisdictions and products may follow different recommendations and criteria.
Our assessment shows that future innovation is likely to depend on the capability of demonstrating differentiated clinical benefit rather than introducing a new mechanism of action. Gene therapy may become available to an even wider range of older patients, and muscle targeting and other complementary approaches are able to help with functional deficiencies regardless of treatment aimed at SMN. Nevertheless, their commercial viability will depend on clinical results, safety, longevity, regulation, and reimbursement. We are convinced that innovations providing additional incremental benefit for certain patient groups can achieve greater differentiation than those having only slight advantage over current treatment options.
As we see it, the implication for strategy lies in the possible broadening of the market, moving from competition amongst well-established treatments to differentiated treatment paths depending on age, disease, prior treatment and unmet clinical need. For the companies involved, the challenge will be not just proving effectiveness but positioning their therapies in relation to the current treatment path and determining if it displaces or compliments established therapies. This will be determined by the number of patients suitable for therapy, clinical benefit, ease of administration and payers willingness to cover treatment cost.
This complete report evaluates the SMA drug pipeline through mechanism of action, stage of development, target patients, trial endpoints, safety data, durability data, delivery systems, and regulatory milestones. It also considers the eligibility of the product as well as lifecycle-expansion capabilities, differentiating between approved drugs and investigable drugs. A comprehensive dataset of the pipeline and innovations would help in supporting the strategic assessment through the collection of data on developer of the product, mechanism, indications, development stage, trial status, target patients, important efficacy and safety data, regulatory milestones, and expected timelines of development of the therapy.
The regulatory status determines the suitability for usage, however, the availability will depend on the country’s reimbursement, technology assessment, budget impact, and infrastructure within the specialty. Although newborn screening is capable of detecting the affected babies before symptom development, it is only cost-effective when confirmatory tests and treatments are available.
It is up to the patient, caregiver, neurologist, genetic counselor, hospital, specialty pharmacy, and payers to determine the treatment modality. Convenience, efficacy, safety, and cost, along with other factors, will be taken into account.
In the existing commercial structure of the market, there are three differentiated products: nusinersen, risdiplam, and onasemnogene abeparvovec. The competition among these products does not depend on efficacy or pricing but rather involves administration, eligibility, patients' age, clinical proof, payer access, and the attractiveness of chronic versus one-time treatment.
Publicly reported sales for 2025 offer valuable benchmarks for individual companies. Sales of Zolgensma amounted to about USD 1.23 billion in 2025. The respective competing franchises also enjoy considerable revenues, though in different reporting periods, currencies, and products. The above product sales must not be confused with the audit of market shares since the denominator of the global market comprises different geographies, discounts, and definitions of the treated market.
There is a focus of the competitive structure on established innovators, while the remaining competitors are small biotech companies that develop complementary or next-generation products. The market entry barriers are high due to the necessity of clinical data for the rare disease, special regulatory capabilities, and the ability to reach out to a small, dispersed patient population.
| Company | Headquarters | Market position | Core strength / relevant segment |
| Biogen | Cambridge, US | Established commercial leader | Nusinersen; antisense therapy |
| Novartis | Basel, Switzerland | Established commercial leader | Onasemnogene abeparvovec |
| Roche | Basel, Switzerland | Established commercial leader | Risdiplam; oral therapy |
| Ionis Pharmaceuticals | Carlsbad, US | Antisense technology specialist | Oligonucleotide platform |
| PTC Therapeutics | Warren, US | Historical development participant | SMA drug development |
| Scholar Rock | Cambridge, US | Clinical-stage challenger | Muscle-targeted therapy |
| Biohaven | New Haven, US | Emerging developer | Neuromuscular research |
| Cytokinetics | South San Francisco, US | Adjacent technology specialist | Muscle-function research |
| Regeneron Pharmaceuticals | Tarrytown, US | Biologics research participant | Antibody engineering |
| Novartis Gene Therapies | US operations | Gene-therapy business unit | SMA gene therapy |
| Catalent | Somerset, US | Manufacturing-services participant | Biologics and gene-therapy services |
| Thermo Fisher Scientific | Waltham, US | Enabling-technology supplier | Bioprocessing and analytics |
| Charles River Laboratories | Wilmington, US | Research-services participant | Preclinical development |
| AskBio | Research Triangle Park, US | Gene-therapy developer | AAV technology |
Company roles, ownership and pipeline relevance require validation against the selected report cut-off date. Service providers and adjacent developers are not counted as direct marketed-therapy competitors.
A reliable competitive ranking requires a consistent denominator covering the same period, geography, and revenue definition. The report therefore distinguishes reported product sales from estimated global market share and separates marketed therapies from investigational assets.
| Competitive metric | Analytical treatment |
| Product revenue | Reported annual sales, with currency and period normalization |
| Global market share | Estimated product revenue divided by the defined market denominator |
| Top-three concentration | Combined share of the principal commercial treatment platforms |
| Growth leadership | Comparable year-on-year product sales growth |
| Share movement | Estimated gains or losses attributable to access, launches and switching |
| Emerging competition | Pipeline maturity, regulatory progress and addressable population |
The basic benchmark measures business potential, evidence of efficacy, safety, route of administration, age indication, coverage, longevity of data, and lifecycle management options. The two well-developed platforms have their strengths: oral administration lowers the process difficulty; intrathecal delivery has an extensive evidence base in the longitudinal format; gene therapy provides the one-off treatment option.
| Benchmark dimension | Oral SMN2 modifier | Intrathecal antisense | Gene replacement |
| Administration | Daily oral dosing | Repeated intrathecal dosing | One-time infusion |
| Recurring treatment revenue | High relevance | High relevance | Limited after initial treatment |
| Specialist infrastructure | Moderate | High | High |
| Upfront expenditure | Lower relative to gene therapy | Recurring | Very high |
| Key differentiation | Convenience and chronic access | Established evidence and broad treatment experience | One-time genetic intervention |
| Key commercial risk | Adherence and competition | Procedure burden and switching | Eligibility, safety, price and durability |
The portfolio strength of SMA does not revolve around marketed products owned by a firm. Instead, it concerns the capacity to offer prolonged support through expansion of eligibility and actually improving patient outcomes. Established companies could utilize existing product infrastructure and relationships they developed with physicians. However, new firms might stand out with novel mechanisms of action or functional improvements in conjunction with currently used treatments.
In order to assess technology benchmarking, several critical areas have been reviewed. These include gene-delivery technologies, oligonucleotide design and optimization, oral formulation development, muscle targeting, scalability of manufacturing technologies and translational abilities of these technologies to the clinic. Together with assessment of patents and regulatory exclusivity, potential problems such as inability to repeat clinical outcomes on the part of competing firms are considered.
This is because the US has well-established specialist infrastructure along with comparatively high levels of treatment expenditure. Europe, on the other hand, provides sophisticated clinical facilities coupled with reimbursement mechanisms at the national level as well as Health Technology Assessment. Japan and advanced Asian countries provide rare disease expertise whereas countries such as China, India, Southeast Asia, etc. provide a different set of competitive opportunities.
Competitive dynamics also depend on the patient population. The use of gene therapy targeting infants is different from chronic oral therapy or intrathecal therapy in adults.
The capacity of manufacturing is measured through technology-related parameters and not based on the presence of plants. Gene therapy manufacturing entails validation of manufacturing and release of the viral vector whereas oligonucleotide manufacturing involves synthesis and purification processes. Supply chain and logistics operations are essential for oral therapy treatments.
The channel analysis focuses on the interaction of the company with neuromuscular centers, hospitals, specialty pharmacies, payers, and support patient organizations. The barriers to switching are based on clinical considerations, treatment patterns, reimbursement, and administrative preference, and not on the brand loyalty of consumers.
Strategic focus areas include expansion of eligible populations, development of complementing mechanisms, enhanced ease of use and improvement of the capability of gene therapy. Expansions in the regulatory labels can change the positioning of the drug without necessitating the creation of a whole new mechanism while clinical assets provide significant value when they provide added benefit for patients using SMN-targeted therapy.
The M&A analysis differentiates between completed acquisitions, announced deals, collaboration, and research partnerships. Deal value is taken into account only when provided, focusing on milestones and maturity of the acquired asset.
Comprehensive company profiles are provided for all companies, with the extent of detail varying according to their individual roles. Product owners in the commercial space receive analyses of sales, growth, product visibility, geographic presence, and lifecycle strategy. The clinical developers are measured according to their pipeline maturity, study design, ability to fund trials, and their IP and commercialization readiness. Enabling technologies are judged by their manufacturing relevance and service visibility, not as competition in the drug market.
The best opportunities are mainly located in four fields: early intervention, better access to treatment in disadvantaged groups, complementary therapy in case of functional impairments remaining and lower costs. The area of adult SMA is especially valuable from the perspective of strategic segments because progress in treatment extends the life expectancy of patients.
If the complementary treatment generates additional revenues without substitution of current treatment, only if additional clinical value is proven and expenditure accepted by payers, and in emerging markets where diagnostics, reimbursement, and cost issues can be more important than yet another premium-priced therapy.
| Force | Assessment | Market-specific rationale |
| Supplier power | Medium-High | Specialized biologics, oligonucleotide manufacturing, and viral-vector capabilities create qualification barriers. |
| Buyer power | High | Public payers and major health systems influence access, reimbursement, and net pricing. |
| Threat of new entrants | Low-Medium | Clinical development, regulatory requirements, intellectual property, and rare-disease trial recruitment limit entry. |
| Threat of substitutes | Medium-High | Established treatment modalities compete for overlapping patients, although clinical eligibility differs. |
| Competitive rivalry | High | Three established treatment platforms compete alongside emerging mechanisms and lifecycle expansions. |
The analysis distinguishes commercial rivalry from true therapeutic substitutability: a new treatment may expand the market, complement existing therapies, or displace an incumbent depending on its clinical evidence and eligible population.
Political and legal factors have an impact on rare disease funding, screening policy, regulatory approvals, and intellectual property protection. Economic factors will determine the payers’ ability and affordability for patients. The social factors involve caregiver issues, disease awareness, and equitable access. Scientific advancements within genetics and production technologies will help generate solutions, while environmental factors concern pharmaceuticals manufacturing and logistics.
| Opportunity area | Attractiveness | Principal consideration |
| Established markets and approved therapies | High | Reimbursement access, competition and lifecycle management |
| Presymptomatic diagnosis and treatment | High | Screening coverage and rapid intervention |
| Adult and underserved populations | High | Evidence generation and unmet clinical needs |
| Complementary muscle-targeted therapies | High potential | Clinical differentiation and payer acceptance |
| Emerging-market expansion | Selectively attractive | Affordability, diagnostics and specialist infrastructure |
| Undifferentiated late-stage entry | Challenging | High development costs and established competitors |
Long-term market evolution will be influenced by how increased diagnosis and expanded eligibility criteria for treatment convert into commercialization. The planning metric of USD 13 billion by 2030 is a growth scenario and not a foregone conclusion. Projections until 2035 need clear assumptions with respect to patient identification, drug penetration, net price, approval, and how competing therapies may complement or replace existing therapies.
The baseline scenario involves continued use of the currently approved drugs along with increased geographical reach. The upside scenario factors in the success of complementary therapies, effective diagnosis, and rapid reimbursement. The downside scenario assumes greater pressure on prices, slower access in emerging markets, and less differentiation from new therapies.
Key strategic considerations involve enhancing early diagnosis, functional benefits, reduced administration burden, adult patient support, and establishing viable reimbursement schemes. The optimal future commercial opportunities are most likely to accrue to those players who have a clinical differentiation of their products as well as robust manufacturing and access along with long-term data.
The fully integrated research methodology involves the inclusion of epidemiology, market sizing by patient type, product economics, competitor intelligence, pipeline assessment, regional access, and strategic forecasting, all as one integrated view of the market for spinal muscular atrophy drugs. The primary aim of this approach is to define the theoretical patient opportunity versus the revenue opportunity within the changing clinical, and competitive environment of the market.
By SMA Type
By Treatment Modality
By Administration Route
By Patient Age Group
By Disease Status
By Treatment Status
By Product
By Region


Principal Consultant
Payal Rabde is a Healthcare Market Research Analyst at Towards Healthcare Research & Consulting with 4+ years of experience in pharmaceuticals, biotechnology, medical devices, and life sciences.
Learn more about Payal Rabde

Reviewed By
Aditi Shivarkar is a seasoned professional with over 14 years of experience in healthcare market research. As a content reviewer, Aditi ensures the quality and accuracy of all market insights and data presented by the research team.
Learn more about Aditi Shivarkar