

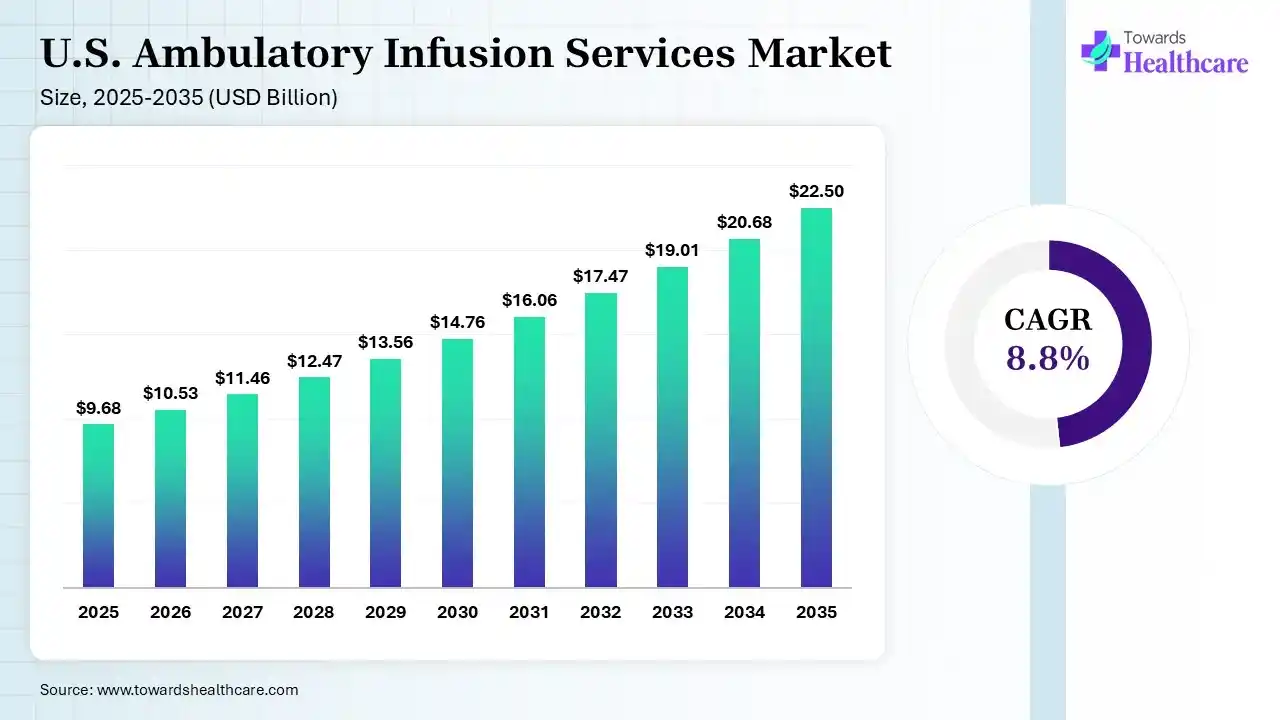
The U.S. ambulatory infusion services market size was estimated at USD 9.68 billion in 2025 and is predicted to increase from USD 10.53 billion in 2026 to approximately USD 22.5 billion by 2035, expanding at a CAGR of 8.8% from 2026 to 2035. Analysis also highlights that the U.S. ambulatory infusion services market is rapidly expanding due to increasing patient volume, growing demand for immunoglobulin therapy, expanding freestanding infusion centers, increasing adoption of Medicaid platforms, and a growing shift towards biweekly infusions.
The U.S. ambulatory infusion services refer to the outpatient programs offering intravenous treatment in clinical or home settings across the U.S. They provide a wide range of medications and biologics across hospital outpatient departments, specialty clinics, independent infusion centers, hybrid/home-linked models, physician offices, and community infusion locations, which are outside the traditional inpatient setting. The report also covers different types of therapies, centers, applications, service components, payer/payment models, care settings, patient age groups, routes of administration, and therapy frequencies, along with market size, buyer intelligence, competitive landscape, and value chain analysis.
Moreover, the market is driven by an increasing shift towards lower-cost outpatient settings from inpatient environments for appropriate therapies, growing recurring treatment requirements for chronic diseases, rising payer-driven site-of-care optimization, and growing use of specialty drugs. This, in turn, is predicted to drive the market expansion from US$9.68 billion and 8.8% CAGR in 2025 to US$22.50 billion by 2035.
Based on the information gathered, the U.S. infusion ecosystem is considerably larger, which places the therapy market at US$19.56 billion in 2025. The growth depends on outpatient & home infusion research, which is a substantial component. Additionally, differences in the scopes eliminate the possibility of mechanically adding these figures to the US$9.68 billion market.
Analyst View
However, the close link between drug economics and service economics is the main commercial constraint. Moreover, management of drug acquisition, chair utilization, payer contracts, reimbursement, nursing labor, and pharmacy operations is essential by infusion providers. Additionally, Option Care Health's 2025 results reported US$5.65 billion in total revenue, with US$5.56 billion of infusion-services net revenue, and served more than 315,000 patients, which represented the scale of this integrated model.
| Therapy Type | Market Share | CAGR | Growth Driver |
| Chemotherapy | 25.00% | 7.60% | Oncology remains a major source of infusion utilization and appropriate treatments continue moving into outpatient settings |
| Immunoglobulin Therapy | 15.00% | 10.20% | Expanding diagnosis of immunodeficiency, neurological and autoimmune indications |
| Blood Product Infusion | 12.00% | 7.90% | Recurring transfusion support and controlled outpatient treatment |
| Iron Therapy | 10.00% | 9.80% | Rapid iron replenishment and growing use where oral therapy is inadequate |
| Hydration Therapy | 8.00% | 7.30% | Dehydration management and alternatives to emergency-department treatment |
| Steroid Infusion | 6.00% | 7.10% | Autoimmune, inflammatory and neurological treatment |
| Plasmapheresis | 5.00% | 8.90% | Neurological and autoimmune disorders |
| Therapeutic Phlebotomy | 3.00% | 6.80% | Chronic hematological conditions |
| Clotting Factor Replacement Therapy | 4.00% | 8.70% | Long-term hemophilia management |
| Antibiotic/Anti-infective Infusion | 5.00% | 8.30% | OPAT and prolonged infection treatment |
| Biologic/Specialty Drug Infusion | 4.00% | 10.00% | Specialty-drug expansion in rheumatology, gastroenterology, neurology and immunology |
| Parenteral Nutrition | 2.00% | 7.50% | Long-term nutritional support |
| Other Therapies | 1.00% | 6.50% | Emerging and specialized therapies |
Based on our research findings, the table covers different types of therapies, their market shares, and CAGR along with their growth factors. The chemotherapy segment dominated the market with 25% in 2025, as oncology was the major source of infusion utilization. The growth in the providers' shift towards outpatient centers also increased their use. The rise in cancer prevalence also sustained their recurring treatment demand. The immunoglobulin therapy segment held the second-largest share of 15% and is expected to expand rapidly with 10.20% CAGR during the forecast period due to rising diagnoses of primary and secondary immunodeficiencies and expanding treatment volumes. Neurological and autoimmune indications broaden IVIG and SCIG utilization. Specialty infusion providers are also increasingly developing dedicated immunoglobulin programs.
Analyst View- Therapy Type
The chemotherapy segment contributes to the largest therapy category as oncology continues to generate substantial recurring infusion activity, while the immunoglobulin therapy segment is driven by increasing use across immunodeficiency and neurological/autoimmune conditions, promoting strong growth opportunities.
This strategic shift is fueling the adoption of specialty drugs, supporting an administration pathway separate from the hospital. The expanding therapy mix of alternate-site infusion providers was reflected by Option Care, which offered limited-distribution drugs and pharmaceutical programs serving more than 600 therapies in 2025.
| Center Type | Market Share | CAGR | Growth Driver |
| Hospital-Based Infusion Centers | 39.00% | 7.20% | Oncology and complex infusion volumes remain concentrated in hospitals |
| Physician-Based Infusion Centers | 23.00% | 8.50% | Specialty practices increasingly control infusion delivery |
| Independent/Freestanding Infusion Centers | 25.00% | 10.20% | Lower-cost, convenient locations and payer-driven site-of-care migration |
| Specialty Pharmacy-Linked Infusion Centers | 8.00% | 9.60% | Integration of dispensing, medication management, and administration |
| Retail / Community-Based Infusion Centers | 5.00% | 10.00% | Convenient locations and shorter travel distances |
As per the analysis, the table covers center types along with their market share, CAGR, and growth drivers. The hospital-based infusion centers segment held the major share of 39% of the market in 2025, due to significant retention of oncology and complex-infusion volumes, presence of integrated clinical infrastructure, and strong physician referral networks which sustained utilization. The independent/freestanding infusion centers segment held the second largest share and is expected to show the highest growth of 10.20% CAGR during the predicted time, due to independent centers competing through convenient locations and lower site-of-care costs, the presence of specialty infusion operators expanding community networks, and payer pressure encouraging migration away from higher-cost hospital settings. Additionally, Option Care's 2025 infrastructure reported 87 full-service pharmacies, 73 with ambulatory infusion suites, and 109 stand-alone ambulatory infusion sites, which mirrored independent infusion operators that combine pharmacy and ambulatory sites.
Analyst View - Center Type
The retention of high-acuity and oncology volumes makes the hospital-based centers segment the largest category, with high competition among providers for convenience and site-of-care economics and fast-growing opportunities for independent and community-based models. The commercial model supports networks capable of combining pharmacy capabilities, specialty nursing, infusion chairs, centralized care coordination, payer contracts, and physician referral networks.
| Disease Area | Market Share | CAGR | Growth Driver |
| Oncology | 31.00% | 7.90% | Recurring cancer treatment and expansion of outpatient biologic/immunotherapy use |
| Autoimmune & Inflammatory Disorders | 22.00% | 10.50% | Biologic adoption across rheumatology and gastroenterology |
| Immunodeficiency Disorders | 13.00% | 10.20% | Increasing diagnosis and recurring immunoglobulin replacement |
| Infectious Diseases | 8.00% | 8.10% | OPAT and prolonged anti-infective therapy |
| Neurological Disorders | 9.00% | 10.30% | IVIG and specialty neurological treatments |
| Hematological Disorders | 6.00% | 8.40% | Recurring supportive therapies |
| Gastrointestinal Disorders | 4.00% | 9.80% | Biologic treatment of inflammatory bowel disease |
| Bone & Musculoskeletal Disorders | 3.00% | 8.70% | Aging population and specialty treatments |
| Dehydration & Electrolyte Disorders | 2.00% | 7.20% | Hydration outside emergency departments |
| Nutritional Disorders | 1.00% | 7.40% | Parenteral nutrition |
| Other Conditions | 1.00% | 6.80% | Emerging specialty indications |
The above-mentioned table reflects the market share and CAGR of various applications along with their growth factors. The oncology segment held the largest share of 31% in 2025, due to cancer treatment, which increased substantial recurring infusion volumes, rising biologic and immunotherapy outpatient treatment opportunities, and a shift towards suitable therapies into ambulatory settings. The autoimmune & inflammatory disorders segment held the second largest share of 22% of the market and is anticipated to show the fastest growth with 10.50% CAGR during the upcoming years due to expansion of biologic adoption for autoimmune diseases, recurring maintenance infusions for rheumatology and gastroenterology, and new specialty therapies broadening the ambulatory treatment pool.
Analyst View - Application
The data covered highlight that the disease mix is shifting toward chronic specialty-care pathways instead of purely episodic infusion. The growth in predictable recurring visits makes autoimmune, neurological, and immunodeficiency treatments attractive to ambulatory providers, creating a close connection between therapy mix and center economics, which develops a center with a high proportion of recurring biologic or immunoglobulin treatments that can achieve more predictable chair utilization compared to a center dependent primarily on short-course hydration or episodic treatments.
| Service Component | Share | CAGR | Growth Driver |
| Infusion Administration | 38.00% | 8.30% | Every treatment episode requires safe administration |
| Clinical & Nursing Services | 24.00% | 9.00% | Monitoring and adverse-event management |
| Pharmacy Services | 18.00% | 10.10% | Specialty-drug dispensing and medication management |
| Care Coordination | 12.00% | 9.70% | Prior authorization, referrals and scheduling |
| Patient Support Services | 8.00% | 9.20% | Education, adherence and follow-up |
As per the survey conducted, the table encompasses service components, growth opportunities, and market shares. The infusion administration segment led the market with 38% share in 2025, as it was essential across every ambulatory treatment episode; higher outpatient volumes increased administration demand, and complex therapies required trained infusion professionals. The pharmacy services segment held 18% market share and is expected to expand rapidly with 10.10% CAGR during the forecast period due to controlled dispensing and medication management for specialty drugs, integrated pharmacy models improve coordination between drug supply and treatment, and high-cost biologics increase the value of pharmacy oversight.
Analyst View - Service Component
The full-service clinical and pharmacy platform is dominating the market rather than simply a chair-and-nurse administration business. Furthermore, specialty drugs drive requirements such as medication sourcing, storage, compounding, authorization, dispensing, adverse-event monitoring, medication management, and coordination with manufacturers and payers, which propels the growth of the pharmacy services segment. Additionally, the model is described as a combination of infusion clinical management, nursing support, and care coordination by Option Care.
| Payer | Share | CAGR | Growth Driver |
| Commercial Insurance | 48.00% | 8.40% | Large specialty-drug population and site-of-care optimization |
| Medicare | 29.00% | 8.70% | Aging population and chronic disease burden |
| Medicaid | 14.00% | 9.60% | Chronic and complex-care needs |
| Self-Pay / Other | 9.00% | 6.90% | Alternative payment channels |
As per Payal Rabde, the senior market research analyst, the table outlines payers, their shares, CAGR, and growth drivers. The commercial insurance segment registered dominance over the market with a 48% share in 2025, as it covered substantial specialty infusion utilization, employers emphasized lower-cost sites of care, and payer networks influenced provider selection and infusion location. The Medicaid segment held a 14% share in 2025 and is predicted to grow with the highest CAGR of 9.60% during the upcoming years, due to growing chronic and complex-care needs, expansion of coordinated specialty-care models, and state-level coverage policies influencing ambulatory infusion access.
Analyst View - Payer
The commercial insurance segment accounts for the largest payer category where payer contracting and network participation are important for provider growth. On the other hand, the highest supplied CAGR contributes to the Medicaid segment due to a large recurring patient pool driven by the age profile of chronic disease. Moreover, roughly 88% of 2025 revenue of Option Care came from commercial payers, including Medicare Advantage, Managed Medicaid, PBMs, and self-pay patients.
| Care Setting | Share | CAGR | Growth Driver |
| Hospital Outpatient Departments | 37.00% | 7.20% | Complex therapies and established hospital infrastructure |
| Physician Offices | 24.00% | 8.80% | Direct physician control of prescribing and administration |
| Independent Ambulatory Infusion Centers | 23.00% | 10.40% | Lower-cost and convenient treatment environments |
| Specialty Clinics | 10.00% | 9.30% | Disease-specific expertise and biologic use |
| Community-Based Infusion Sites | 6.00% | 10.00% | Convenience and decentralization |
Based on our research, the hospital outpatient departments segment held the dominant share of 37% of the market in 2025, due to growth in complex and oncology-focused infusion volumes, rise in advanced therapies and monitoring, and specialist referrals also sustained treatment throughput. The independent ambulatory infusion centers segment held 23% market share in 2025 and is anticipated to grow with the fastest CAGR of 10.40% during the predicted period because independent centers offer lower-cost and convenient treatment environments, specialty operators continue adding community locations, and payers increasingly support migration from higher-cost hospital sites.
Analyst View - Care Setting
A clear decentralization trend supported by provider economics is represented by the above-mentioned segments, with the hospital outpatient departments contributing to the largest setting and independent ambulatory centers with rapid expansion. The alternate-site model of Option Care provides infusion services across homes and other nonhospital settings as well as promotes cost-effective care.
| Age Group | Share | CAGR | Growth Driver |
| Adults 65+ - Dominating | 39.00% | 8.90% | Higher chronic-disease and specialty-treatment burden |
| Adults 45–64 | 34.00% | 9.10% | Oncology, autoimmune and neurological disorders |
| Adults 18–44 | 20.00% | 10.20% - Fastest Growing | Autoimmune/inflammatory disorders and long-term biologic use |
| Pediatric | 7.00% | 9.80% | Immunodeficiency and rare diseases |
The given table covers different types of age groups, market shares, and their growth factors. The 65+ years segment held the largest share of 39% of the market in 2025, as they experienced higher rates of chronic and complex diseases; specialty drug utilization increased with age-related disease burden, and recurring infusion requirements also sustained long-term service demand. The 18-44 years segment held 20% market share in 2025 and is expected to expand rapidly with 10.20% CAGR during the forecast period, as autoimmune and inflammatory disorders affect a substantial younger population, long-term biologic treatment creates recurring infusion requirements, and increasing patient preference for convenient care supports ambulatory utilization.
Analyst View - Patient Age
The close relationship between chronic disease and specialty-care needs contributes to the dominance of adults 65+, where autoimmune and inflammatory conditions requiring long-duration specialty therapies are responsible for the fast growth rate of younger adults. The age mix is also affected by the central requirements, such as specialized monitoring and clinical staffing for pediatric infusion programs and stronger coordination across multiple chronic conditions for older-adult programs.
| Route | Share | CAGR | Growth Driver |
| Intravenous | 79.00% | 8.20% | Oncology, immunoglobulin and specialty therapies |
| Subcutaneous | 17.00% | 11.20% | Increasing availability of therapies suitable for SC administration |
| Intramuscular | 3.00% | 7.00% | Selected specialty medications |
| Other Routes | 1.00% | 6.50% | Emerging formulations |
Based on our research, the intravenous segment dominated the market with a 79% share in 2025 because IV administration remained central to ambulatory specialty therapies; oncology, immunoglobulin, and biologic therapies generated significant IV demand; and specialized centers maintained infrastructure for controlled intravenous delivery. The subcutaneous segment held the second-largest share of 17% in 2025 and is predicted to show the highest growth with 11.20% CAGR during the upcoming years, as more specialty therapies are becoming suitable for subcutaneous administration, their shorter administration times improve patient convenience, and drug developers are increasingly designing therapies for less resource-intensive delivery.
Analyst View - Route
The operational core position of ambulatory infusion services is held by IV administration, while subcutaneous delivery is strategically important as it minimizes resource requirements and administration time for eligible therapies. However, future chair utilization, staffing models, and center throughput can be affected by the growth of SC delivery, whereas the need to redesign operations for shorter administration times and hybrid therapy pathways may be required by the providers depending on IV chair hours.
| Frequency | Share | CAGR | Growth Driver |
| Monthly Infusion | 31.00% | 9.20% | Predictable maintenance therapy |
| Biweekly Infusion | 24.00% | 10.20% | Recurring biologic and specialty treatment |
| Weekly Infusion | 20.00% | 9.50% | Immunoglobulin and specialty therapies |
| Long-Term/Maintenance Infusion | 17.00% | 8.90% | Chronic disease management |
| Single/Short-Course Infusion | 8.00% | 7.30% | Anti-infective and hydration treatment |
As per the analysis conducted by our senior market research analyst, Payal Rabde, the monthly infusion segment held the major market share of 31% in 2025 as monthly biologic and specialty therapies created predictable utilization, recurring appointments supported efficient center scheduling, and maintenance treatment increased shifts toward outpatient settings. The biweekly infusion segment held the second-largest share of 24% of the market in 2025 and is anticipated to show the fastest growth with 10.20% CAGR during the predicted years, due to biweekly biologic regimens generating recurring patient visits, autoimmune and oncology therapies driving utilization, and convenient ambulatory sites supporting long-term adherence.
Analyst View - Frequency
For ambulatory infusion, recurring therapy acts as the economic backbone as predictable visits allow providers to optimize chair capacity, pharmacy operations, and nursing schedules. On the other hand, predictable recurring utilization without the operational intensity associated with daily or short-course treatment makes biweekly and monthly therapies attractive from a scheduling perspective.
| Factor | Market/Intelligence Scope | 2025 Benchmark | Market Implication |
| TAM | U.S. home infusion therapy | US$19.56B | Provides a broad infusion-services benchmark encompassing home-based treatment |
| SAM | Ambulatory/outpatient infusion | 42% outpatient share in the referenced global outpatient & home infusion market | Indicates a substantial facility-based outpatient treatment opportunity |
| SOM | Provider-level obtainable market | Determined by payer lives, local patient volume, referral networks, therapy coverage, and chair capacity | Provider opportunity is geographic and contract dependent rather than a fixed percentage of TAM |
| Consumer Behavior | Preference for convenient care | Decentralization and alternate-site treatment are major industry themes | Convenience, travel time, scheduling and treatment duration affect site-of-care choice |
| Buyer Intelligence | Hospital/physician/payer/specialty-pharmacy ecosystem | Option Care served 315,000+ patients and administered 2.5M+ infusions in 2025 | Demonstrates the operational scale possible through a national alternate-site platform |
As per the information gathered by our senior researcher, Aman Singh, the table illustrates the U.S. ambulatory infusion services along with addressable market and buyer intelligence. Additionally, he also highlights that, as the scopes differ, the U.S. home-infusion benchmark should not be directly combined with the supplied US$9.68 billion ambulatory market.
Analyst View - TAM/SAM/SOM
With the use of local capacity and payer accessibility, instead of applying an arbitrary percentage to the national market, better measurement of SOM is possible for an individual infusion operator. The covered lives within the provider's payer network, disease-specific patient volume, physician referral density, number of competing infusion chairs, therapy authorization, specialty-drug contracts, geographic travel radius, chair utilization, nursing capacity, and pharmacy capability are the most useful SOM variables. Thus, these factors make the market highly suitable for ZIP-code, MSA, payer-network, and physician-referral-level commercial intelligence.
| Consumer Behavior Factor | Market Implication |
| Preference for convenience | Encourages community and independent infusion locations |
| Lower travel burden | Particularly important for recurring monthly/biweekly therapies |
| Reduced hospital exposure | Supports appropriate alternate-site treatment |
| Predictable scheduling | Important for chronic specialty therapies |
| Shorter treatment duration | Increases attractiveness of efficient outpatient settings |
| Insurance coverage | Strong determinant of treatment location |
| Therapy familiarity | Recurring patients may favor established infusion providers |
| Clinical confidence | Complex therapies require experienced nursing and monitoring |
| Patient education | Important for adherence and adverse-event awareness |
| Home/ambulatory flexibility | Enables individualized site-of-care pathways |
A wide range of consumer behaviour factors and their implications in the market are mentioned in the given table. Furthermore, according to the survey conducted, with the use of company-specific measures instead of industry-wide consumer metrics, a total of 92% overall patient satisfaction was reported by Option Care in 2025. It also recorded over 315,000 patients and more than 2.5 million infusion events.
Analyst View - Consumer Behavior
A convenience + clinical confidence + financial access lens is being utilized by the patient to scrutinize infusion services, while recurring therapies, location, and scheduling are considered essential to enhance patient experience as much as the administration itself. Therefore, opportunities to differentiate through evening/weekend scheduling, shorter wait times, digital appointment management, convenient community locations, treatment reminders, transparent insurance support, consistent nursing teams, and follow-up communication can be created for providers.
| Buyer | Primary Decision Criteria | Commercial Importance |
| Health systems | Clinical capability, reimbursement, capacity, quality | Major hospital-based volume |
| Physicians | Clinical expertise, scheduling, patient convenience | Major referral source |
| Payers | Total cost of care, site-of-care economics, outcomes | Controls network access |
| Specialty pharmacies | Drug access, dispensing, coordination | Critical for specialty therapies |
| Pharmaceutical manufacturers | Patient access, adherence, limited-distribution support | Supports specialty-drug programs |
| Employers | Cost, access, employee convenience | Relevant to commercial populations |
| Patients | Convenience, coverage, quality, travel distance | Influences site-of-care acceptance |
According to the analysis conducted by our senior researcher, Aman Singh, the given table represents different types of buyers, primary decision criteria, and their commercial importance across the market. The key provider selection criteria include payer network participation, reimbursement rates, specialty-drug access, physician referral relationships, clinical staffing, pharmacist availability, emergency/adverse-event capabilities, chair capacity, medication preparation/compounding, prior-authorization support, geographic accessibility, scheduling flexibility, care coordination, patient satisfaction, drug inventory management, electronic health-record connectivity, accreditation/compliance, and specialty therapy expertise.
Analyst View - Buyer Intelligence
A multi-sided purchasing ecosystem is represented by the U.S. ambulatory infusion market, where physicians initiate or direct treatment, pharmacies manage drug supply, patients receive the service, infusion operators provide clinical administration, and payers influence the site of care. Thus, payer access and physician referrals contribute to two of the most important commercial assets for an infusion provider. Conversely, a center with available chairs but weak referral relationships or payer coverage may not achieve attractive utilization. Furthermore, 96% coverage of insured lives through its top 10 payers, indicating the strategic value of national payer relationships, was recorded in Option Care's 2025 investor presentation.
It is one of the clearest publicly disclosed benchmarks for the U.S. alternate-site infusion market.
| Metric | 2025 |
| Total revenue | US$5.650B |
| Infusion-services net revenue | US$5.556B |
| Patients served | 315,000+ |
| Infusion events | 2.5M+ |
| Therapies | 600+ |
| U.S. locations | 190+ |
| Full-service pharmacies | 87 |
| Pharmacies with ambulatory infusion suites | 73 |
| Stand-alone ambulatory infusion sites | 109 |
| Multidisciplinary clinicians | 5,000+ |
| Infusion chairs | 750+ |
| Insured lives covered by top 10 payers | 96% |
| Patient satisfaction | 92% |
In 2025, the company recorded total revenue of US$5.650B, while infusion-services net revenue was noted to be US$5.556B, where it served more than 315,000 patients, hosted over 2.5M infusion events, and delivered beyond 600 therapies. It operates across more than 190 U.S. locations, where it offers 87 full-service pharmacies, 73 pharmacies with ambulatory infusion suites, 109 stand-alone ambulatory infusion sites, more than 5,000 multidisciplinary clinicians, and over 750 infusion chairs. It also accounted for 96% of insured lives covered by the top 10 payers, with 92% patient satisfaction.
Sources: Option Care's 2025 10-K and investor materials.
| Year | Infusion Services Net Revenue |
| 2023 | US$4.223B |
| 2024 | US$4.912B |
| 2025 | US$5.556B |
The table compares years with their infusion services net revenue, which confirms that Option Care's infusion-services revenue increased from US$4.22 billion in 2023 to US$5.56 billion in 2025.
Analyst View - Competitive Position
The commercial advantage of scale, pharmacy, clinical infrastructure, payer contracting, and geographic density is demonstrated by Option Care, highlighting that drug procurement and pharmacy operations are economically significant components of the model, and ambulatory infusion is not simply a clinical-administration business.
| Operational Metric | 2025 |
| Patients served | 315,000+ |
| Infusion events | 2.5M+ |
| Therapies served | 600+ |
| Locations | 190+ |
| Clinicians | 5,000+ |
| Infusion chairs | 750+ |
The useful graph-ready indicators provided by Option Care's 2025 operating data are covered in the table. It represents approximately 7.9 infusion events per patient per year and nearly 3,333 patients per reported location are noted based on the company's reported figures. These calculations are obtained simply from company-reported totals and should not be interpreted as industry averages.
| Stage | Major Function |
| Drug manufacturer | Specialty drug development and supply |
| Wholesaler/pharmacy | Drug distribution |
| Specialty pharmacy | Dispensing, compounding, and medication management |
| Infusion provider | Administration and nursing |
| Physician | Diagnosis, prescription and treatment oversight |
| Payer | Coverage and reimbursement |
| Patient | Treatment recipient and site-of-care participant |
As per the survey conducted, the table reflects core value chain functions. It covers various value chain stages such as drug manufacturer, specialty pharmacy/wholesaler, infusion provider, physician/referral source, payer, and patient, along with their functions.
Analyst View - Value Chain
The characterization of the market depends on vertical coordination, where providers can connect specialty pharmacy, infusion administration, and nursing, while payer management focuses on reducing coordination friction and capturing more value, favoring scaled operators. Disease-specific expertise, community accessibility, and local physician relationships help maintain the competitive position of independent providers.
A wide range of growth drivers are promoting the market expansion, which were identified with the use of Option Care's 2025 investor materials, highlighting therapy growth, cost pressures, patient preference, and the shift toward home and alternate-site infusion models. The shift from inpatient to outpatient treatment helps expand ambulatory volume, specialty drug approvals drive the therapy pool, while a growing aging population helps increase chronic disease burden. The rise in autoimmune disease treatment promotes recurring biologic administration, increasing immunoglobulin demand supports high-frequency specialty infusion, while OPAT helps move appropriate infection treatment outside hospitals. The payer site-of-care management promotes lower-cost settings; community infusion expansion reduces patient travel, and specialty pharmacy integration improves drug/service coordination. Moreover, rising demand for subcutaneous formulations changes administration economics, and increasing chronic disease management contributes to recurring utilization.
Different types of market constraints are responsible for limiting market growth. High specialty-drug costs drive payer scrutiny, prior authorization can delay treatment, nursing shortages reduce capacity, pharmacy staffing requirements induce operating complexity, and payer concentration increases contracting dependency. Similarly, drug shortages can disrupt treatment schedules, site-of-care restrictions limit provider flexibility, reimbursement changes alter therapy economics, and competition from home infusion can reduce facility-based volume. Moreover, subcutaneous alternatives reduce chair-based IV utilization, hospital-owned networks lead to referral competition, and regulatory/quality requirements increase compliance costs.
Analyst View - Market Constraints
The balance between lower-cost site-of-care delivery and increasingly expensive specialty drugs is the biggest structural issue. If drug reimbursement, labor costs, or payer contracts are unfavorable, patient volume can be increased by a provider without proportionately improving profitability.
Independent Community Infusion Networks
It contributes to a 10.2% CAGR for independent/freestanding centers, offering an opportunity to develop geographically distributed, lower-overhead alternatives to hospital outpatient departments.
Immunoglobulin-Focused Programs
The growing demand for IVIG/SCIG leads to a recurring patient base with relatively predictable treatment schedules
Autoimmune and Inflammatory Specialties
They focus on rheumatology and gastroenterology and contribute to strong recurring biologic-treatment demand.
Specialty-Pharmacy Integration
They emphasize that provider economics can be solidified by combining drug dispensing, prior authorization, medication management, and administration.
Subcutaneous Administration
They accounted for an 11.2% CAGR, creating strategic importance of SC administration with evolving pharmaceutical formulations.
Payer-Focused Site-of-Care Programs
They support providers in the development of preferred alternate-site pathways for therapies that do not require hospital infrastructure.
Physician-Office Partnerships
They contribute to specialty practices offering a direct source of referrals and disease-specific treatment expertise.
Data-Driven Capacity Management
They focus on optimizing chair utilization through patient adherence tracking, appointment forecasting, and therapy-frequency analysis.
By Therapy Type
By Center Type
By Application/Disease Area
By Service Component
By Payer/Payment Model
By Care Setting
By Patient Age Group
By Route of Administration
By Therapy Frequency
The U.S. ambulatory infusion services market focuses on site-of-care optimization instead of simple infusion-volume growth. As per the supplied segmentation, the hospital outpatient departments dominated the setting, while independent/freestanding centers, community locations, and physician-linked models are expected to experience the highest growth rates.
The combination of recurring specialty therapies + payer support + physician referrals + pharmacy integration drives the strongest commercial opportunities. This, in turn, contributes to the increased attention towards immunoglobulin, autoimmune/inflammatory biologics, neurological therapies, and other recurring specialty treatments. Moreover, Option Care's 2025 operating model demonstrates the importance of combining pharmacy infrastructure, payer coverage, clinical workforce, physical sites, and care coordination, suggesting that scale alone is not sufficient at the provider level.
Thus, it can be concluded that U.S. state-by-state and MSA-level intelligence can be the most valuable expansion for the next stage of market research, including major operators, infusion-center counts, physician referral density, payer environment, chair capacity and competitive whitespace, and oncology/autoimmune patient pools.
Payal Rabde, Senior Research Analyst, led the primary market research, developed the methodology, analysed trends, segmentation, competition, forecasts, and strategic opportunities, forming the report's analytical foundation.
Aman Singh, senior researcher, was responsible for collecting and validating clinical trial data, research publications, company information, partnerships, and other quantitative datasets, strengthening evidence-based analysis and market estimations.
Aditi Shivarkar, senior researcher, reviewed the complete research document, performed quality checks, validated findings, refined content, corrected inconsistencies, and finalized the report, ensuring accuracy, clarity, credibility, and publication-ready quality.


Principal Consultant
Payal Rabde is a Healthcare Market Research Analyst at Towards Healthcare Research & Consulting with 4+ years of experience in pharmaceuticals, biotechnology, medical devices, and life sciences.
Learn more about Payal Rabde

Reviewed By
Aditi Shivarkar is a seasoned professional with over 14 years of experience in healthcare market research. As a content reviewer, Aditi ensures the quality and accuracy of all market insights and data presented by the research team.
Learn more about Aditi Shivarkar