

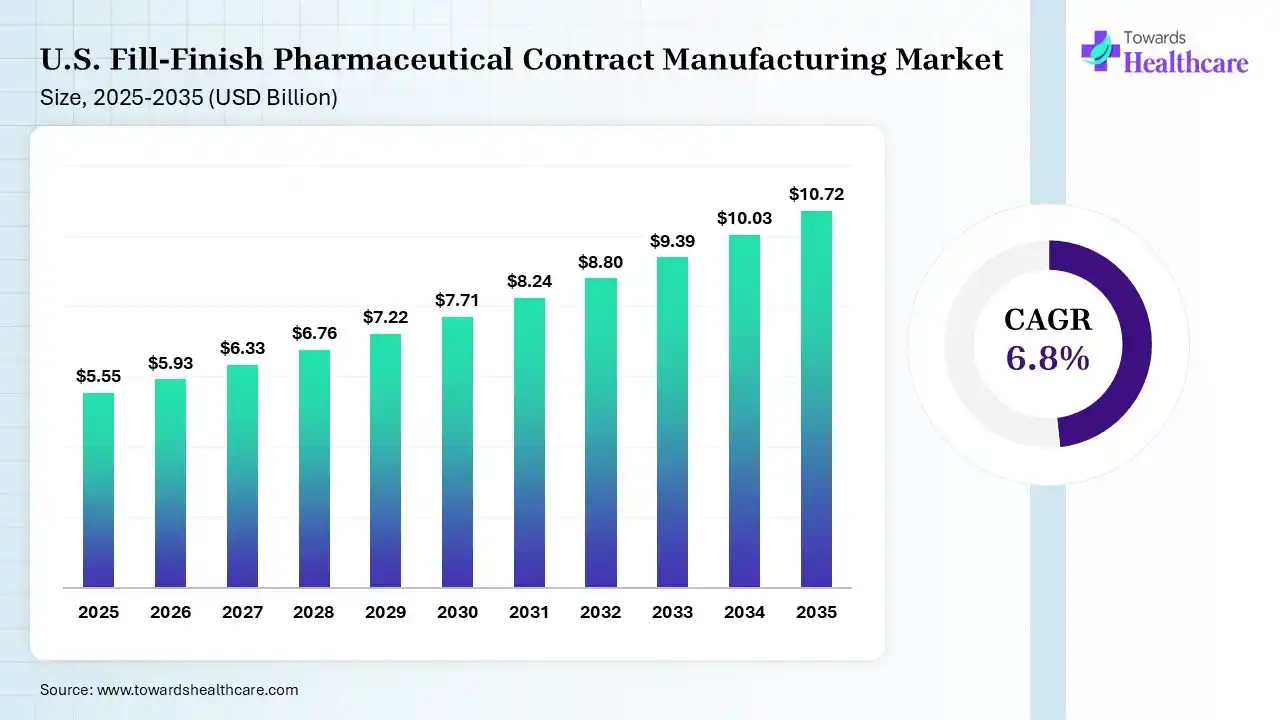
The U.S. fill-finish pharmaceutical contract manufacturing market size was estimated at USD 5.55 billion in 2025 and is predicted to increase from USD 5.93 billion in 2026 to approximately USD 10.72 billion by 2035, expanding at a CAGR of 6.8% from 2026 to 2035. Her analysis highlights that the U.S. fill-finish pharmaceutical contract manufacturing market is rapidly expanding due to growing biologics approvals, rising demand for disposable bioprocessing systems, advancements in oncology therapies, a shift towards aseptic fill-finish capabilities, and key industry players like Novo Nordisk A/S, Novo Holdings A/S, Catalent, Inc., Danaher Corporation, and Sartorius AG/Sartorius Stedim Biotech.
The U.S. fill-finish pharmaceutical contract manufacturing refers to the outsourced sterile manufacturing processes across the U.S., such as aseptic filling, lyophilization, terminal sterilization, inspection, and secondary packaging, which are used to convert bulk drug substance into ready-to-administer injectables like vials, prefilled syringes, cartridges, and ampoules. They help ensure regulatory compliance, reduce operational costs, and enhance access to sterile facilities. They are preferred for the production of biologics, vaccines, cell & gene therapies, biosimilars, and monoclonal antibodies.
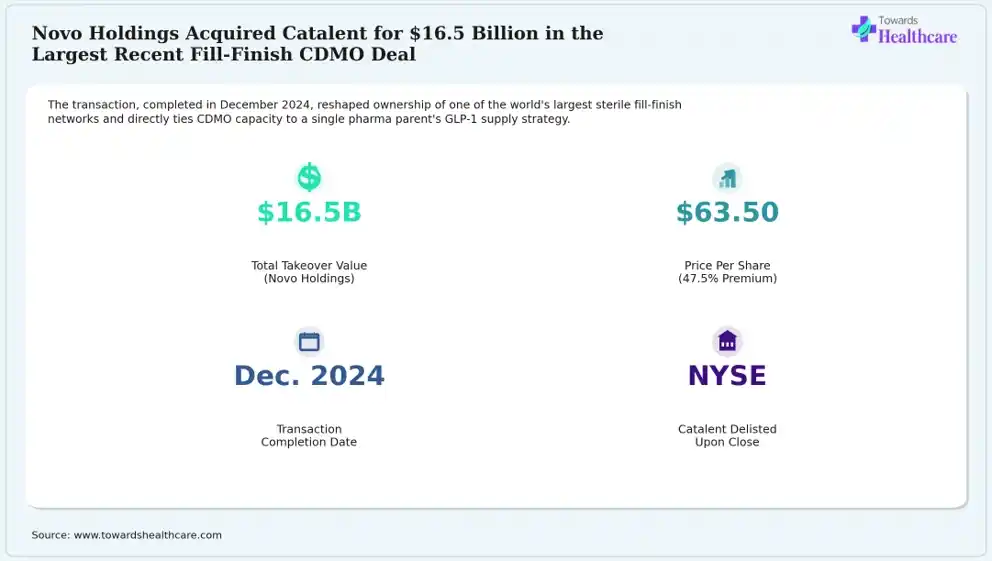
Graph 1: As the market research analyst, I interpret that the given infographic stat panel highlights Novo Holdings–Catalent acquisition metrics, which reshaped ownership of one of the world's largest sterile fill-finish networks. The total takeover value was noted to be $16.5 billion, with a price per share of $63.50. The transaction completion date was recorded to be December 2024, with its post-close status recorded as Catalent delisted from NYSE.
Key Insight:
This largest fill-finish CDMO transaction highlights that sterile injectable manufacturing capacity has become a strategic asset where large pharma companies are eager to pay a premium for direct control and not merely rent.
Source: Catalent, “Novo Holdings Completes Acquisition of Catalent,” Dec. 20, 2024; pharmaphorum, “Novo completes $16.5bn takeover of Catalent,” 2024.
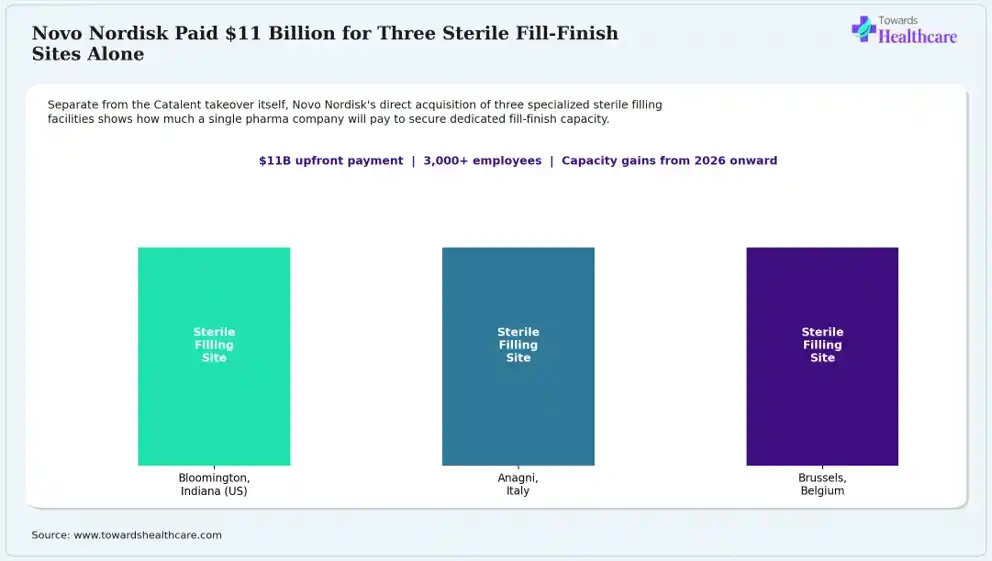
Graph 2: The above-mentioned geographic infographic highlights three sterile fill-finish sites acquired by Novo Nordisk, which marks the expansion of its dedicated fill-finish capacity. Site 1 is located in Bloomington, Indiana, U.S.; site 2 is situated in Anagni, Italy, while site 3 is located in Brussels, Belgium.
Key Insight:
With the separate acquisition of three specific fill-finish sites for $11 billion, Novo Nordisk confirmed that even well-funded pharma companies are unable to expand sterile fill-finish capacity quickly through organic build-out alone.
Source: Novo Nordisk, SEC Form 6-K, Feb. 5, 2024 and Dec. 18, 2024; Davis Polk, “FTC clearance of Novo Nordisk acquisition of certain Catalent sites,” 2024.
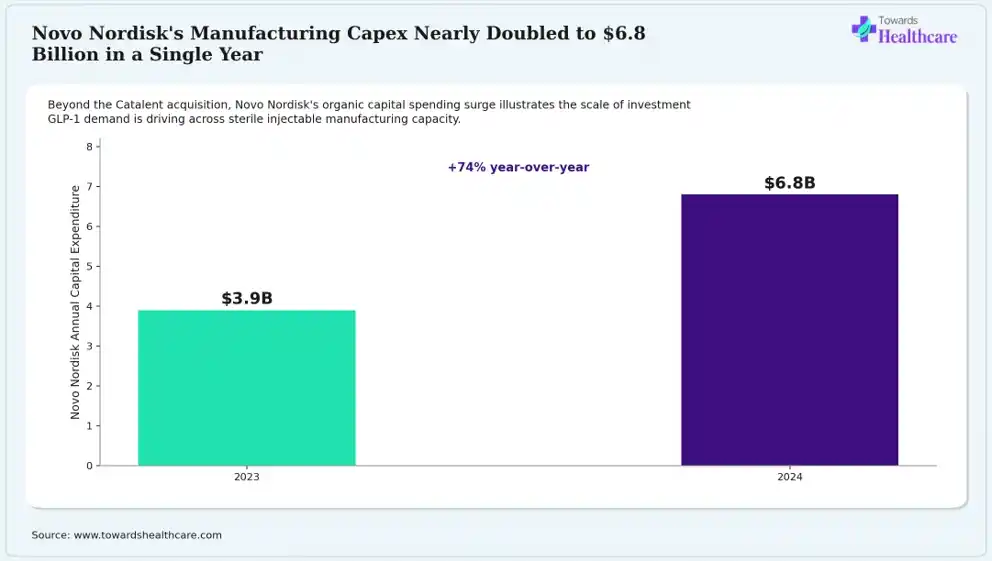
Graph 3: As per the analysis conducted by Aman, the bar chart compares Novo Nordisk's annual capex in 2023 and 2024. In 2023, Novo Nordisk's capital expenditure was reported to be $3.9 billion, which increased to $6.8 billion, indicating a rise of 74% in the year 2024. This rise also highlights the growing investments in GLP-1, which promotes sterile injectable manufacturing capacity.
Key Insight:
The growth in capital spending by 74%, along with a $11 billion acquisition, fuels sterile fill-finish capacity expansion, making it one of the largest capital allocation priorities for any GLP-1 manufacturer.
Source: pharmaphorum, “Novo completes $16.5bn takeover of Catalent,” 2024 (citing Novo Nordisk capital investment disclosures).
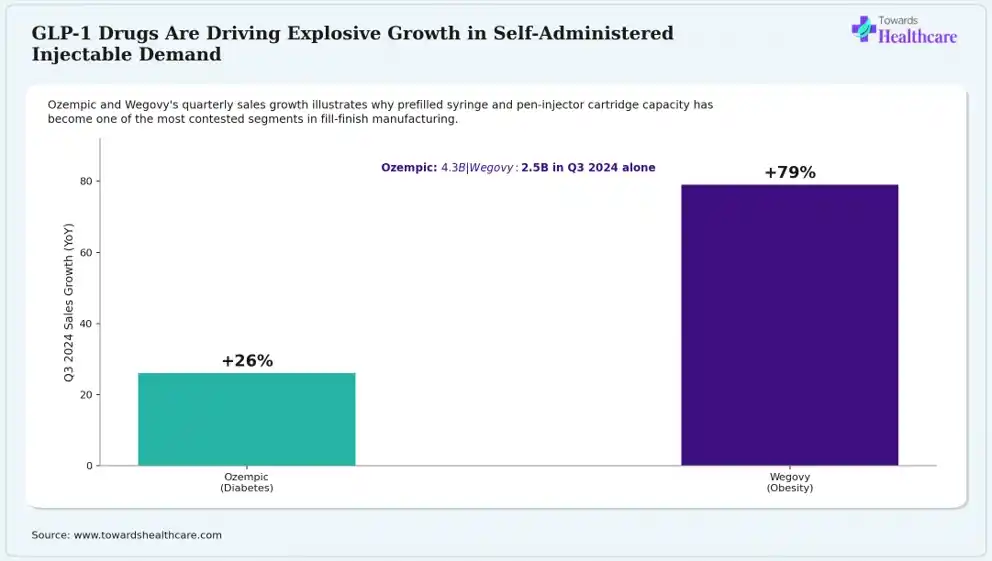
Graph 4: Based on our research, the bar chart compares Ozempic and Wegovy Q3 2024 sales growth, highlighting a rise in the demand for prefilled syringe and pen-injector cartridge capacity. In 2024, the Q3 sales of Ozempic, a diabetes drug, were noted to be $4.3 billion, which contributed to a rise of 26%, while the Q3 sales of Wegovy, an obesity drug, were reported to be $2.5 billion, which represented a growth of 79%.
Key Insight:
The growing demand for Wegovy, reflecting a rise of 79% in a single quarter, confirms the rapid expansion of the obesity-drug segment, which promotes the demand for new prefilled syringe and auto-injector fill-finish capacities.
Source: BioPharma Dive, “Novo Holdings to buy contract drugmaker Catalent for $16.5B,” Feb. 2024 (citing Novo Nordisk Q3 2024 sales data).
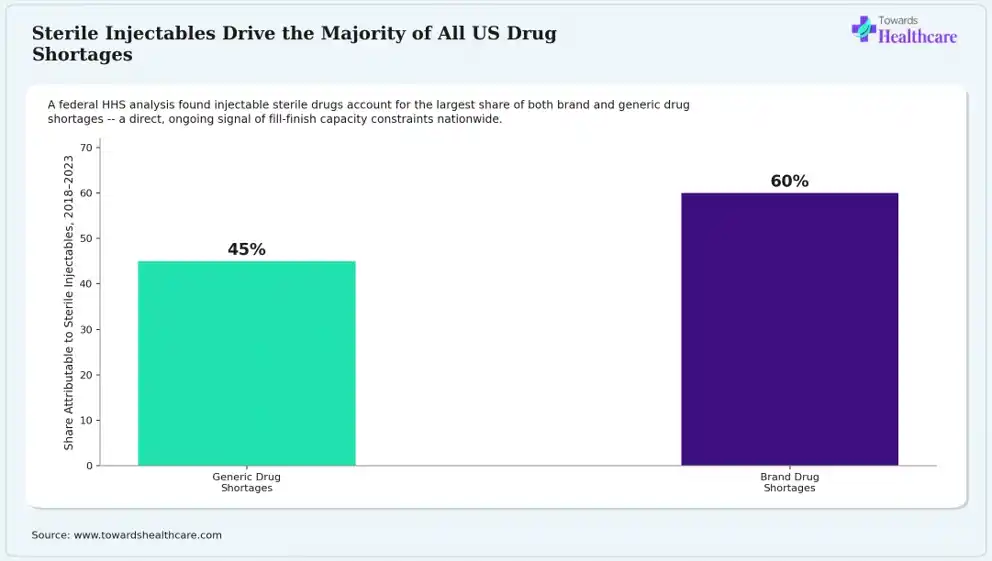
Graph 5: The given bar chart represents the sterile injectable share of drug shortages by category, from 2018 to 2023. The share attributed to sterile injectables of generic drug shortages contributed 45%, while it was reported to be 60% for brand drug shortages, which acts as the major restraint on fill-finish capacity in the U.S.
Key Insight:
The growing brand-drug shortages due to sterile injectables lead to capacity-constrained fill-finish manufacturing, which affects generic-drug costs as well as poses a major threat to branded, higher-value injectable products.
Source: HHS/ASPE, “Analysis of Drug Shortages, 2018-2023,” Jan. 10, 2025.
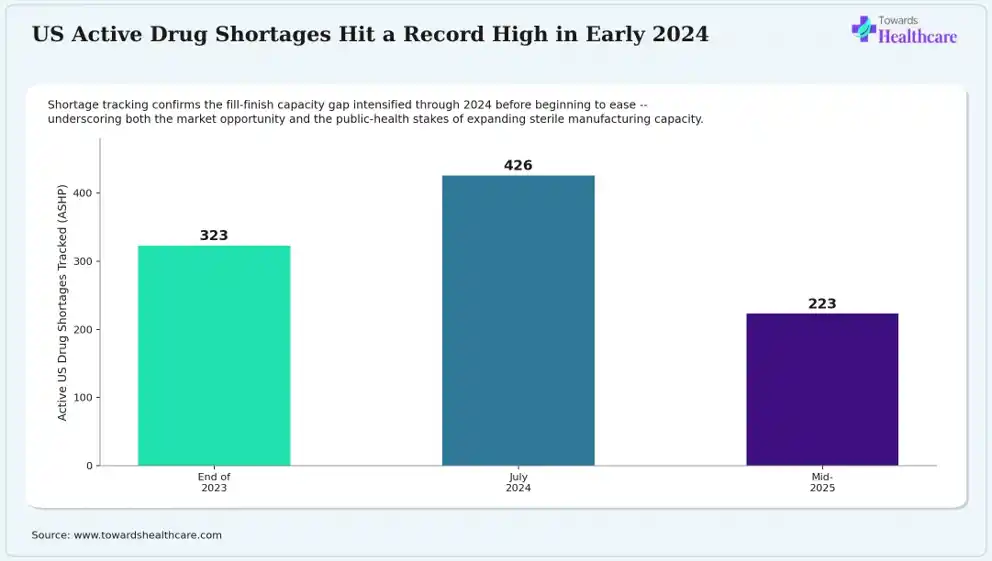
Graph 6: According to the information gathered by Aman, the given bar chart illustrates the active U.S. drug shortage count from the end of 2023 through mid-2025. At the end of 2023, the active U.S. drug shortage was reported to be 323, whereas in July 2024 it increased by 32% to 426. In 2025, it dropped to 223, which highlighted the rise in the demand for sterile manufacturing capacity and new market opportunities.
Key Insight:
Sterile manufacturing capacity indicates rising fill-finish capacity constraints and the need for capacity investment to reverse the trend.
Source: Clarkston Consulting, “Drug Shortage Series: An Overview of Drug Shortages in the U.S.,” 2026; ASHP, “Drug Shortages Statistics,” 2025–2026.
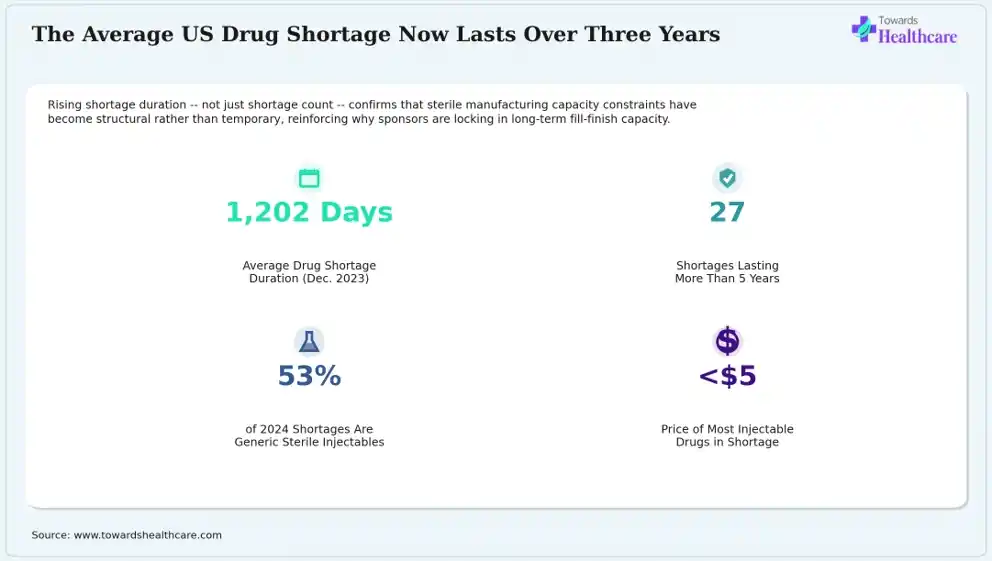
Graph 7: The infographic stat panel covers the drug shortage duration and pricing metrics. The average drug shortage duration in December 2023 was reported to be 1,202 days, which is more than 3 years, and shortages lasting more than 5 years accounted for 27. The 2024 shortages that are generic sterile injectables contributed to 53%, while the price of most injectable drugs in shortage was noted to be under $5. Thus, this highlights the sterile manufacturing capacity constraints that drive the long-term fill-finish capacity contracts.
Key Insight:
The majority of shortage-affected injectables priced under $5 are the major cause discouraging fill-finish investment, which specifically affects generic sterile injectable products, leading to their prolonged shortage.
Source: Clarkston Consulting, “Drug Shortage Series: An Overview of Drug Shortages in the U.S.,” 2026.
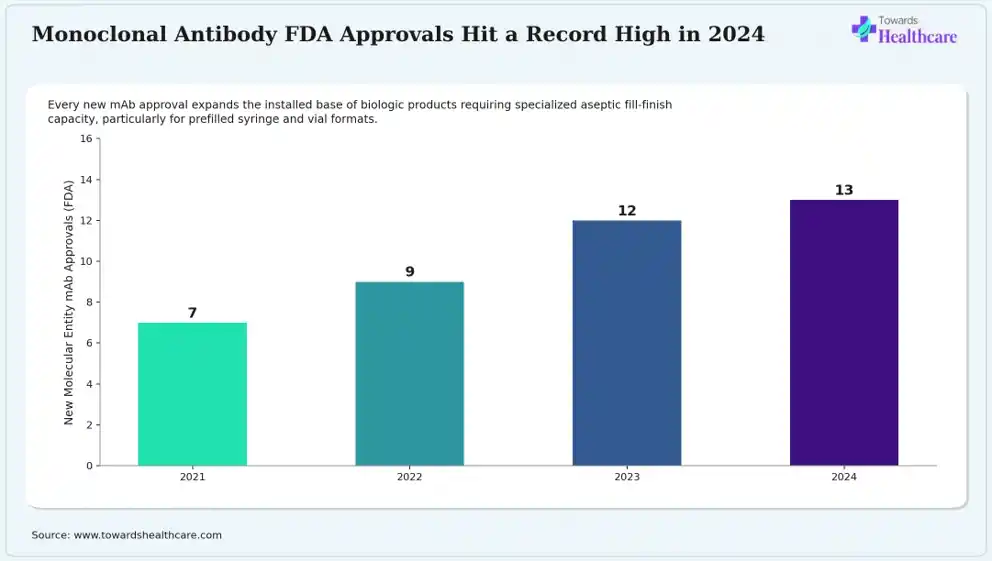
Graph 8: As the market research analyst, I interpret that the given bar chart represents annual FDA mAb approvals from 2021 to 2024, which demonstrates significant growth. In 2021, the number of new molecular entity mAb approvals by the FDA was noted to be 7, which increased to 9 in 2022. 2023, reported a total of 12 approvals of new molecular entity mAbs, which increased to 13 in 2024. This highlights that growing approvals are expanding biologics production, driving the demand for specialized aseptic fill-finish capacity.
Key Insight:
The growing monoclonal antibody approvals are promoting the biologics manufacturing expansion, fueling the demand for aseptic fill-finish CDMOs at a faster rate compared to small-molecule injectable growth.
Source: PMC, “The Pharmaceutical Industry in 2024: An Analysis of the FDA Drug Approvals,” peer-reviewed.
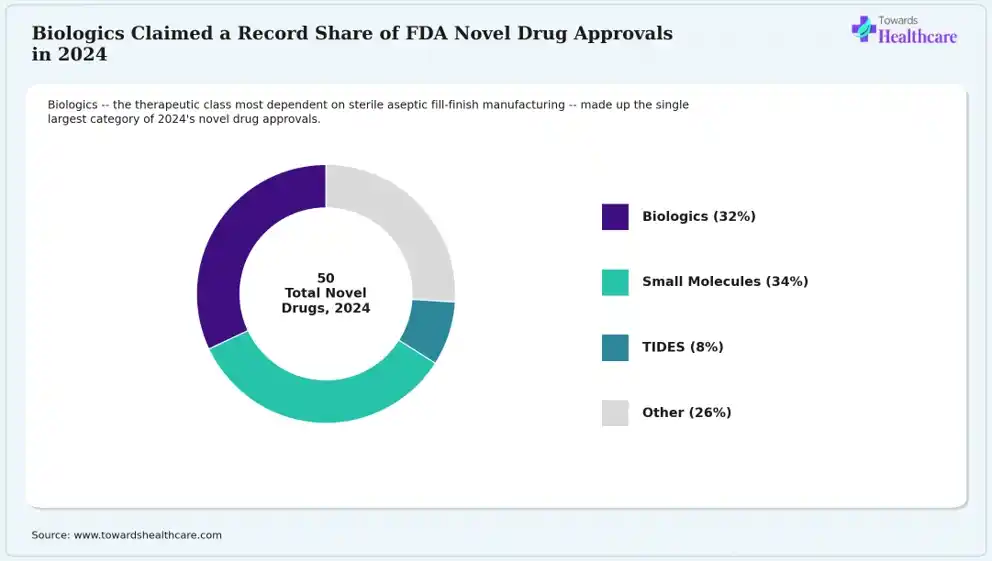
Graph 9: The given donut chart highlights FDA novel drug approvals by category in the year 2024. The biologics approved by the FDA in 2024 held a share of 32%, while small molecules registered dominance with a 34% share of 2024 FDA novel drug approvals. On the other hand, TIDES (peptides/oligonucleotides) contributed 8%, while the other drug approvals accounted for 26%. Thus, with the rise of biologics and TIDES approvals, the use of sterile aseptic fill-finish manufacturing will increase.
Key Insight:
With the growing approvals of biologics and TIDES together representing 40% of novel approvals, the need for specialized sterile injectable manufacturing, specifically fill-finish CDMO show a rapid expansion.
Source: PMC, “The Pharmaceutical Industry in 2024: An Analysis of the FDA Drug Approvals,” peer-reviewed.
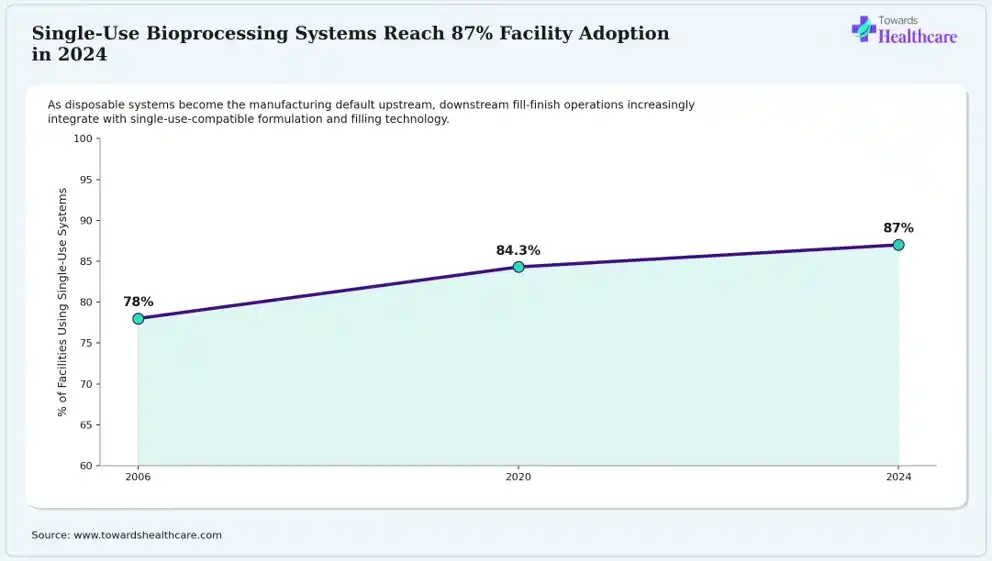
Graph 10: Based on our research, the line chart illustrates single-use bioprocessing system adoption across 2006-2024. In the year 2006, approximately 78% of facilities utilized single-use systems, which increased to 84.3% in 2020, while 2024 recorded that 87% of facilities utilized single-use systems, highlighting a shift towards disposable systems.
Key Insight:
The rising preference for single-use bioprocessing systems is fueling the competition among fill-finish CDMOs for seamless filling lines integrating with single-use formulation and hold systems, not just aseptic capability.
Source: BioPlan Associates, 21st Annual Report and Survey of Biopharmaceutical Manufacturing Capacity, 2024.
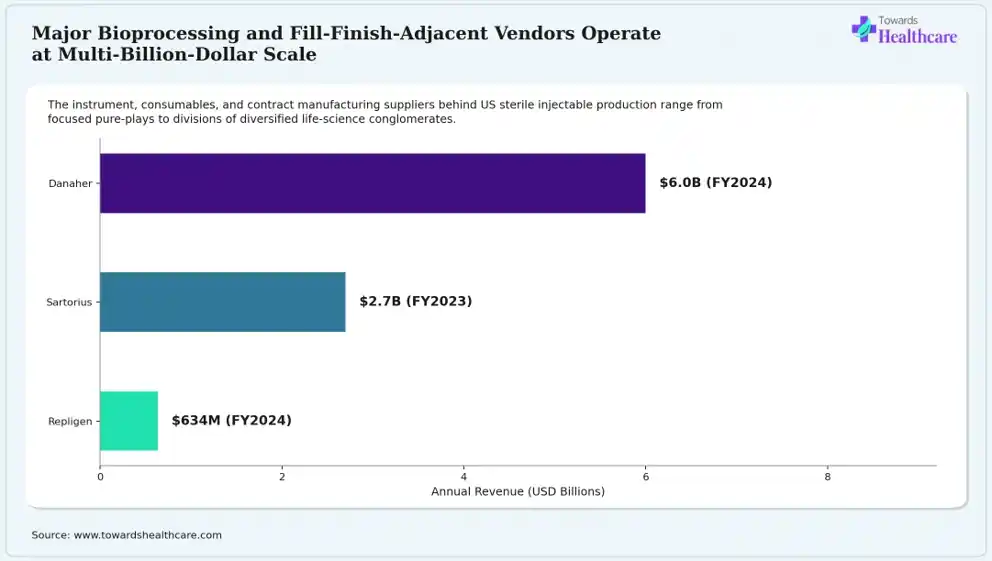
Graph 11: As per our analysis, the horizontal bar chart represents major bioprocessing vendor by their annual revenue. The FY2023 revenue of Sartorius Bioprocess Solutions was reported to be $2.7 billion. The annual revenue of Repligen Corporation for FY2024 was reported to be $634 million, while the FY2024 annual revenue of the Danaher Biotechnology segment contributed approximately $6 billion, which made it the major player in the market.
Key Insight:
The rapid expansion of Danaher compared to Repligen indicates a significant gap due to fundamentally different competitive strategies that fill-finish CDMOs depend on for filtration, single-use, and process-analytical equipment.
Source: Danaher 2024 Annual Report; Sartorius Group FY2023 Results; Repligen Q4/FY2024 Earnings Release, Feb. 2025.
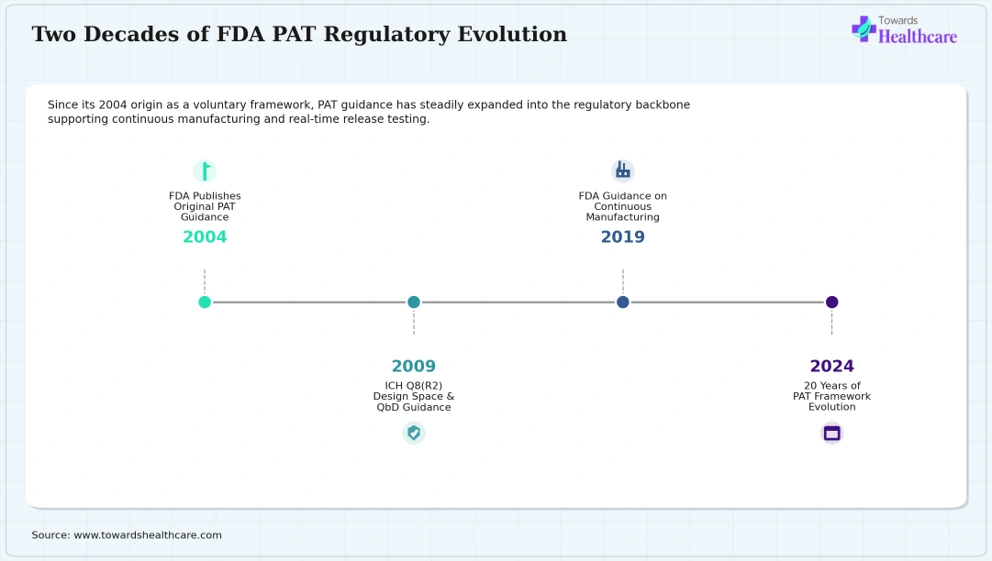
Graph 12: The above-mentioned timeline infographic covers FDA PAT regulatory milestones, from 2004 to 2024. In 2004, FDA published original PAT guidance, while in 2009, ICH Q8(R2) formalized Quality by Design principles. Continuous manufacturing guidance was published by FDA in 2019, and 2024 marked the 20th anniversary of the PAT framework.
Key Insight:
The automated visual inspection and container closure integrity testing systems distinguishing modern fill-finish CDMOs from legacy operators are highlighted by PAT's evolution into a continuous-manufacturing regulatory cornerstone.
Source: FDA Federal Register, Oct. 2004; ISPE Pharmaceutical Engineering, Sept.–Oct. 2020.
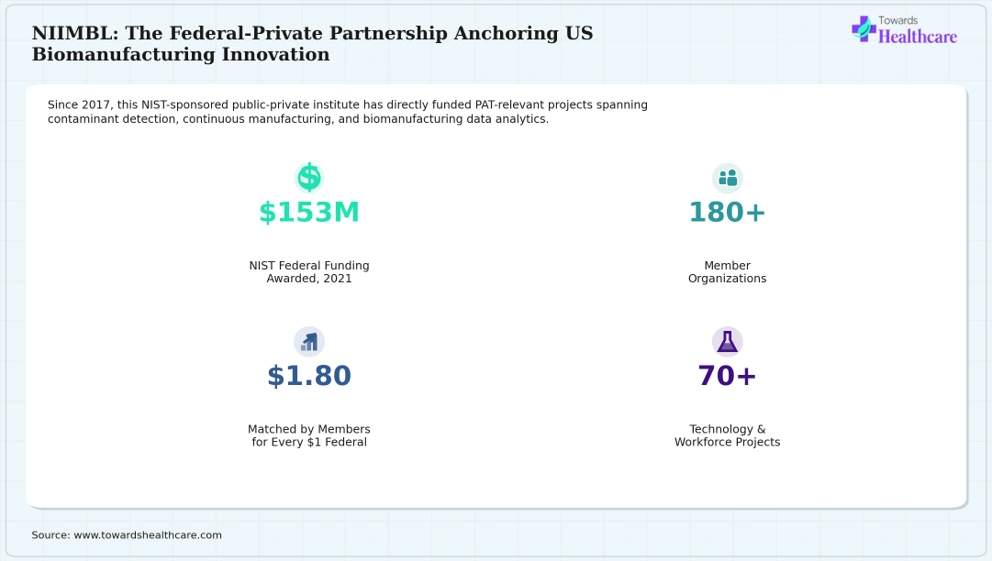
Graph 13: As per the survey conducted, the infographic stat panel encompasses NIIMBL federal-private partnership metrics relevant to sterile fill-finish and continuous manufacturing capacity. In 2021, NIST federal funding awarded a total of $153 million; member organizations contributed to more than 180 projects. The non-federal funding matched per $1 federal was noted to be $1.80, while technology/workforce projects funded to date exceeded 70.
Key Insight:
A policy-level complement to private capital, such as Novo's $11B site acquisition that goes through U.S. sterile fill-finish capacity, is supported by federal investment in biomanufacturing innovation through NIIMBL.
Source: US Department of Commerce/NIST Press Release, July 14, 2021.
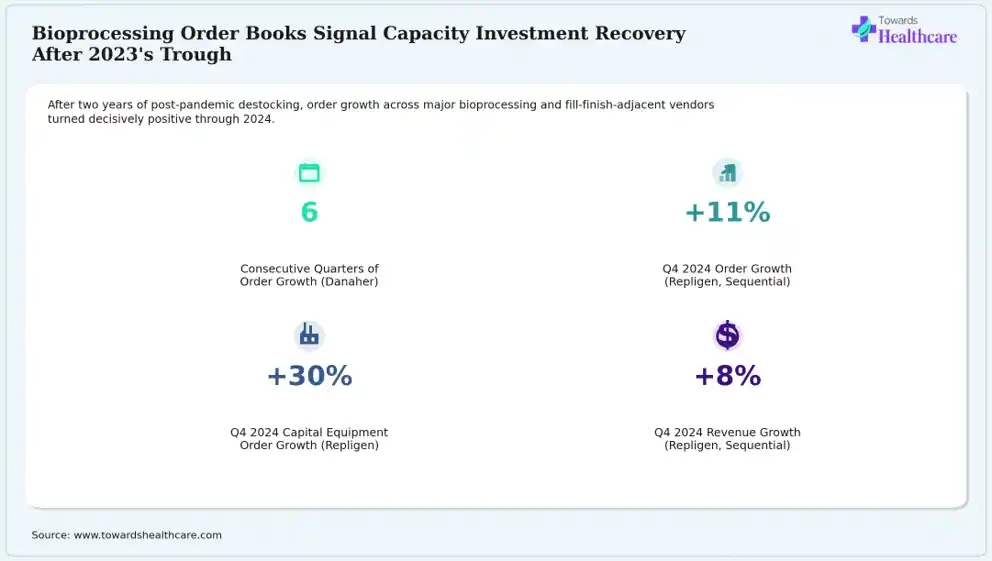
Graph 14: The given infographic stat-panel covers bioprocessing vendor order recovery metrics. The consecutive quarters of order growth by Danaher were reported to be 6, while the Q4 2024 order growth and revenue growth of Repligen, sequentially, experienced a rise of 11% and 8%, respectively. Q4 2024 capital equipment order growth for Repligen also reported a rise of 30%.
Key Insight:
It was confirmed that the biomanufacturers are resuming capital investment in fill-finish-adjacent equipment after the post-pandemic inventory correction, due to six consecutive quarters of accelerating orders.
Source: Danaher Q4 2024 Earnings Call Transcript, Jan. 2025; Repligen Q4/FY2024 Earnings Release, Feb. 2025.
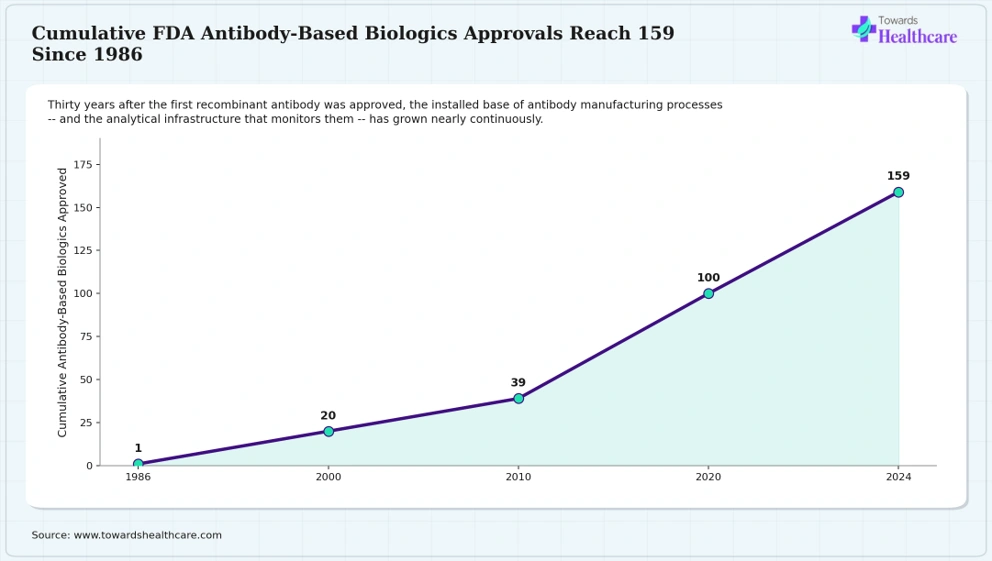
Graph 15: As the market research analyst, I interpret that the line chart illustrates cumulative FDA antibody-based biologics approvals from 1986 to 2024, which demonstrates exponential growth. In 1986, a total of 1 cumulative antibody-based biologic was approved, whereas in 2000 reported approval of 20 antibody-based biologics. In 2010, cumulative antibody-based biologics approved were reported to be 39, which increased to 100 in 2020. Moreover, 2024 recorded the highest peak with 159 cumulative antibody-based biologics approvals. Therefore, the growing approvals drive the demand for dedicated sterile fill-finish capacity.
Key Insight:
The growing cumulative antibody approvals confirm biologics fill-finish demand is intensifying rather than merely growing linearly.
Source: Oxford Academic, Antibody Therapeutics journal, “Structure and function of therapeutic antibodies approved by the US FDA in 2024,” June 2025.
| Indicator | Value | Source |
| Largest recent fill-finish CDMO acquisition (Novo Holdings–Catalent) | $16.5 billion | Catalent, Dec. 2024 |
| Novo Nordisk's direct fill-finish site acquisition | $11 billion for 3 sites | Novo Nordisk SEC filing, 2024 |
| Novo Nordisk annual capex (2024) | $6.8 billion (+74% YoY) | pharmaphorum, 2024 |
| Active U.S. drug shortages (peak, 2024) | 426 | ASHP / Clarkston Consulting |
| Cumulative FDA antibody-based biologic approvals (2024) | 159 | Oxford Academic, 2025 |
| Single-use bioprocessing facility adoption (2024) | 87% | BioPlan Associates, 2024 |
Table 1: The table covers various acquisitions, annual revenue, and FDA approvals leading to a rise in the use of fill-finish pharmaceutical contract manufacturing services. The largest recent fill-finish CDMO acquisition was Novo Holdings–Catalent, which was $16.5 billion, while Novo Nordisk's direct fill-finish site acquisition accounted for $11 billion for 3 sites. Novo Nordisk's annual capex for 2024 was recorded to be $6.8 billion, where the single-use bioprocessing facility adoption in 2024 held 87%. In 2024, active U.S. drug shortages reached a peak of 426, where the cumulative FDA antibody-based biologic approvals were reported to be 159.
This section encompasses pharmaceutical pipeline & procedure volume analysis and manufacturing infrastructure & capacity analysis.
| Metric | Value | Source |
| New molecular entity mAb approvals (2024) | 13 (record) | PMC, peer-reviewed, 2025 |
| Cumulative antibody-based biologic approvals (since 1986) | 159 (as of 2024) | Oxford Academic, Antibody Therapeutics, 2025 |
| Biologics' share of 2024 FDA novel drug approvals | 32% (16 of 50) | PMC, peer-reviewed, 2025 |
| TIDES (peptide/oligonucleotide) share of 2024 approvals | 8% (4 of 50) | PMC, peer-reviewed, 2025 |
| Ozempic Q3 2024 sales growth | +26% ($4.3B) | BioPharma Dive, citing Novo Nordisk Q3 2024 data |
| Wegovy Q3 2024 sales growth | +79% ($2.5B) | BioPharma Dive, citing Novo Nordisk Q3 2024 data |
Table 2: As per the analysis conducted, the given information highlights FDA approvals from 1986 to 2024 with their sales growth. From 1986 to 2024, the cumulative antibody-based biologic approvals were reported to be 159, whereas in 2024 the new molecular entity mAb, biologics' share of FDA novel drugs, and TIDES (peptide/oligonucleotide) share of approvals contributed to 13, 32%, and 8%, respectively. Furthermore, Ozempic Q3 2024 sales growth was reported to rise by 26%, leading to $4.3B, while a rise of 79%, achieving $2.5B, highlighted the Wegovy Q3 2024 sales growth.
|
Metric
|
Value
|
Source
|
|
Novo Holdings–Catalent acquisition value
|
$16.5 billion
|
Catalent, Dec. 2024
|
|
Novo Nordisk's direct acquisition of 3 fill-finish sites
|
$11 billion
|
Novo Nordisk SEC Form 6-K, 2024
|
|
Employees at the 3 acquired sites
|
3,000+
|
Novo Nordisk SEC filing, 2024
|
|
Expected capacity gain timing from acquired sites
|
From 2026 onward
|
Novo Nordisk SEC filing, 2024
|
|
Single-use bioprocessing system adoption (2024)
|
87% of facilities
|
BioPlan Associates, 2024
|
|
Average largest bioreactor size (2024, upstream proxy)
|
3,664 liters (down from 4,718L in 2017)
|
BioPlan Associates, 2024
|
Table 3: The given table focuses on recent acquisitions. It highlights that the Novo Holdings–Catalent acquisition value was $16.5 billion, where its direct acquisition of 3 fill-finish sites accounted for $11 billion. Employees at the 3 acquired sites contributed to more than 3,000, while expected capacity gain timing from acquired sites was reported to be from 2026 onwards. In 2024, single-use bioprocessing system adoption and average largest bioreactor size were noted to be 87% of facilities and 3,664 liters, respectively.
The Supply Chain & Value Chain Analysis, Cost Structure & Unit Economics, Pricing & Contract Economics, Company Profiles & Benchmarking, and Customer & Outsourcing Behavior are covered in this section.
The fill-finish value chain analysis focuses on API/drug substance supply and also covers formulation and bulk drug product preparation, sterile filtration, filling and stoppering, lyophilization, inspection, packaging, and distribution capabilities.
|
Metric
|
Value
|
Source
|
|
Sterile injectables' share of brand drug shortages
|
60%
|
HHS/ASPE, 2025
|
|
Sterile injectables' share of generic drug shortages
|
45%
|
HHS/ASPE, 2025
|
|
Share of 2024 shortages that are generic sterile injectables
|
53%
|
Clarkston Consulting, 2026
|
|
Average shortage duration (Dec. 2023)
|
1,202 days
|
Clarkston Consulting, 2026
|
Table 4: As the market analyst, I interpret that the given table shows sterile injectable shortages. Sterile injectables' share of brand drug shortages contributed 60%, whereas its generic drug shortages were reported to be 45%. The share of 2024 shortages that are generic sterile injectables accounted for 53%, where the average shortage duration in December 2023 was noted to be 1,202 days. Thus, this drives the demand for an improved supply chain for proper API/drug substance distribution in order to overcome these shortages.
At an industry level, no fill-finish CDMO publicly releases aggregate cost-per-batch, cost-per-vial, or cost-per-syringe figures. Thus, drug-shortage pricing data is considered the clearest available proxy for cost pressure. It displays that more than half of injectable drugs facing shortages are priced under $5, reflecting that shortage risk and CDMO investment incentives are structurally misaligned due to thinning of a substantial share of the addressable market and unit economics.
Source: Clarkston Consulting, “Drug Shortage Series: An Overview of Drug Shortages in the U.S.,” 2026.
The verified price-per-batch, price-per-vial, or price-per-prefilled-syringe benchmarks are not published by any fill-finish CDMO or industry at a national level, which makes them confidential, negotiated contract terms. Therefore, the above mentioned drug-shortage price data and the scale of capital sponsors willing to secure capacity directly, such as Novo Nordisk's $11B site acquisition, are the only verifiable pricing-adjacent signals available.
| Metric | Value | Source |
| Danaher Biotechnology segment revenue (FY2024) | ~$6.0 billion | Danaher 2024 Annual Report |
| Sartorius Bioprocess Solutions revenue (FY2023) | $2.7 billion | Sartorius Group FY2023 Results |
| Repligen Corporation revenue (FY2024) | $634 million | Repligen Q4/FY2024 Earnings Release |
| Repligen Q4 2024 sequential order growth | +11% | Repligen Q4/FY2024 Earnings Release |
| Danaher consecutive quarters of bioprocessing order growth | 6 | Danaher Q4 2024 Earnings Call |
Table 5: Based on our research, the table highlights revenue growth of various market players. The FY2024 revenue of Danaher Biotechnology was noted to be approximately $6.0 billion, and its consecutive quarters of bioprocessing order growth showed a rise of 6%, while the FY2023 revenue of Sartorius Bioprocess Solutions accounted for $2.7 billion. Similarly, the FY2024 revenue of Repligen Corporation was reported to be $634 million, where its Q4 2024 sequential order growth experienced a rise of 11%.
Based on the verified evidence, acute supply risks drive outsourcing and capacity-securing decisions. The growing sterile injectables brand-drug shortages and average shortage duration exceeding three years are encouraging large pharma sponsors to expand their capacity, like Novo Nordisk's direct site acquisition, rather than depending on conventional supply contracts, which are increasingly shifting standard CDMO outsourcing towards direct ownership or long-term dedicated-capacity arrangements to de-risk supply continuity.
This section covers eight segmentation dimensions such as Product Type, Molecule Type, Fill-Finish Service Type, Formulation Type, Primary Packaging Container, End Use, API Potency, and Company Size along with their market-share and CAGR percentages.
|
Segment
|
Verified Data Point
|
Source
|
|
By Product Type - Prefilled Syringes
|
Wegovy's 79% Q3 2024 sales growth drives the demand for self-administration-oriented container format
|
BioPharma Dive, 2024
|
|
By Molecule Type - Large Molecules
|
Since 1986, a total of 159 cumulative FDA antibody-based biologics were approved, with 13 new mAbs approvals in 2024 alone
|
Oxford Academic, 2025; PMC, 2025
|
|
By Fill-Finish Service Type - Aseptic Fill-Finish
|
87% single-use bioprocessing adoption reflects the modern aseptic infrastructure, which is operated mostly by fill-finish CDMOs
|
BioPlan Associates, 2024
|
|
By End Use - Biologics
|
Biologics contributes as the largest single category with 32% of all 2024 FDA novel drug approvals
|
PMC, 2025
|
|
By Company Size - Large Pharmaceutical Companies
|
Novo Nordisk's $11B direct site acquisition highlights that large pharma companies are focusing on securing capacity rather than depending on traditional CDMO outsourcing services
|
Novo Nordisk SEC filings, 2024
|
Table 6: The above-mentioned table highlights the major segments along with their growing advancements. By product type, the prefilled syringes segment is expected to show the fastest growth with 8.40% CAGR, due to growing self-administration therapies. By molecule type, the large molecules segment held 38% due to increasing use in oncology therapies, while by fill-finish service type, the aseptic fill-finish segment led the market with 49% due to the rise in demand for temperature-sensitive sterile medicines. By end use, the biologics segment dominated the market with 45% due to expansion of biologic pipelines, while by company size, the large pharmaceutical companies segment held a major share of 56% due to generation of substantial commercial injectable volumes.
On February 5, 2024, an agreement to acquire Catalent for $16.5 billion was announced by Novo Holdings, which also included a related $11 billion transaction to directly acquire three of Catalent's fill-finish sites.
Source: BioPharma Dive, Feb. 2024
On May 29, 2024, an approval for the Novo Holdings acquisition was voted on by Catalent stockholders.
Source: Novo Nordisk SEC Form 6-K, 2024
On December 18, 2024, after the Catalent stock delisting from the NYSE and completion of Novo Nordisk's $11 billion acquisition of three sterile fill-finish sites, the Novo Holdings-Catalent transaction was announced to be closed.
Source: Catalent press release; Davis Polk, Dec. 2024
In 2024, the annual capital expenditure rose from $3.9 billion in 2023 to $6.8 billion in 2024, reflecting a rise of 74%, which highlighted accelerated investment in sterile injectable manufacturing capacity, as announced by Novo Nordisk.
Source: pharmaphorum, 2024
In July 2024, in 2023 the U.S. active drug shortages were recorded to be 323, which increased to 426, indicating a 32% rise, making sterile injectables the majority of affected products.
Source: Clarkston Consulting, 2026; ASHP, 2025–2026
On January 10, 2025, the “Analysis of Drug Shortages, 2018-2023,” published by HHS/ASPE, confirmed 60% of sterile branded injectables and 45% of generic drug shortages.
Source: HHS/ASPE Data Brief, Jan. 2025
On April 9, 2025, in a report published by the U.S. GAO focusing on FDA's drug shortage oversight highlighted that 102 active shortages were reported as of July 31, 2024, and indicated that shortages are lasting longer, even with a decline in new shortage counts since the pandemic.
Source: GAO-25-107110, April 2025
It is a large pharmaceutical company and the GLP-1 manufacturer that acquired 3 fill-finish sites for $11B (2024) and noted that capex rose to $6.8B.
It is an investment arm of the Novo Nordisk Foundation, which supported the acquisition of Catalent for $16.5 billion.
It is a former independent global CDMO with major fill-finish operations, which was delisted from the NYSE upon its $16.5B acquisition.
It is a diversified life-sciences conglomerate, where its Biotechnology segment contributed approximately $6.0B in revenue in FY2024 and supports fill-finish-adjacent equipment.
It is a global bioprocessing equipment and consumables supplier, where its bioprocess solutions division's FY2023 revenue accounted for $2.7B.
It is a pure-play bioprocessing technology company with FY2024 revenue of $634M.
It is the federal agency that regulates and approves biologics requiring sterile fill-finish manufacturing, and as of 2024, it has approved 13 new mAbs.
It is the federal office responsible for publishing authoritative drug shortage analysis, such as 2018–2023 drug shortage data briefs.
It is the professional association tracking active U.S. drug shortages, where it published the most current active drug shortage count, which accounted for 223 as of mid-2025.
It is the NIST-sponsored public-private biomanufacturing innovation institute that received $153M in NIST federal funding and consists of more than 180 members.
Aditi is a healthcare services research expert with strong experience in capacity consolidation, GLP-1 demand, and the sterile injectable supply markets. She conducted detailed market research, analyzed company data, clinical trends, and industry developments. Based on her comprehensive analysis, the following strategic key takeaways highlight the most important market insights and opportunities.
For Service Providers & CDMOs
For Pharma & Biotech Companies
For Investors & Corporate Strategy Teams
Based on my assessment, the market is expanding significantly due to growing acquisitions leading to an expansion of fill-finish pharmaceutical contract manufacturing capabilities. I also anticipate that the new collaboration and investments among the major companies can enhance access to their services. The growth in biologics and TIDES FDA approvals will also drive the demand for these services. I also see strong growth in the adoption of prefilled syringes and cell and gene therapies, which will create new market opportunities.
Payal Rabde led the primary market research, developed the methodology, analyzed trends, segmentation, competition, forecasts, and strategic opportunities, forming the report's analytical foundation.
Aman was responsible for collecting and validating clinical trial data, research publications, company information, partnerships, and other quantitative datasets, strengthening evidence-based analysis and market estimations.
Aditi reviewed the complete research document, performed quality checks, validated findings, refined content, corrected inconsistencies, and finalized the report, ensuring accuracy, clarity, credibility, and publication-ready quality.
By Product Type
By Molecule Type
By Fill-Finish Service Type
By Formulation Type
By Primary Packaging Container
By End Use
By API Potency
By Company Size

















Principal Consultant
Payal Rabde is a Healthcare Market Research Analyst at Towards Healthcare Research & Consulting with 4+ years of experience in pharmaceuticals, biotechnology, medical devices, and life sciences.
Learn more about Payal Rabde

Reviewed By
Aditi Shivarkar is a seasoned professional with over 14 years of experience in healthcare market research. As a content reviewer, Aditi ensures the quality and accuracy of all market insights and data presented by the research team.
Learn more about Aditi Shivarkar