
Pipeline Programs

CGT Companies Tracked

Manufacturing Facilities


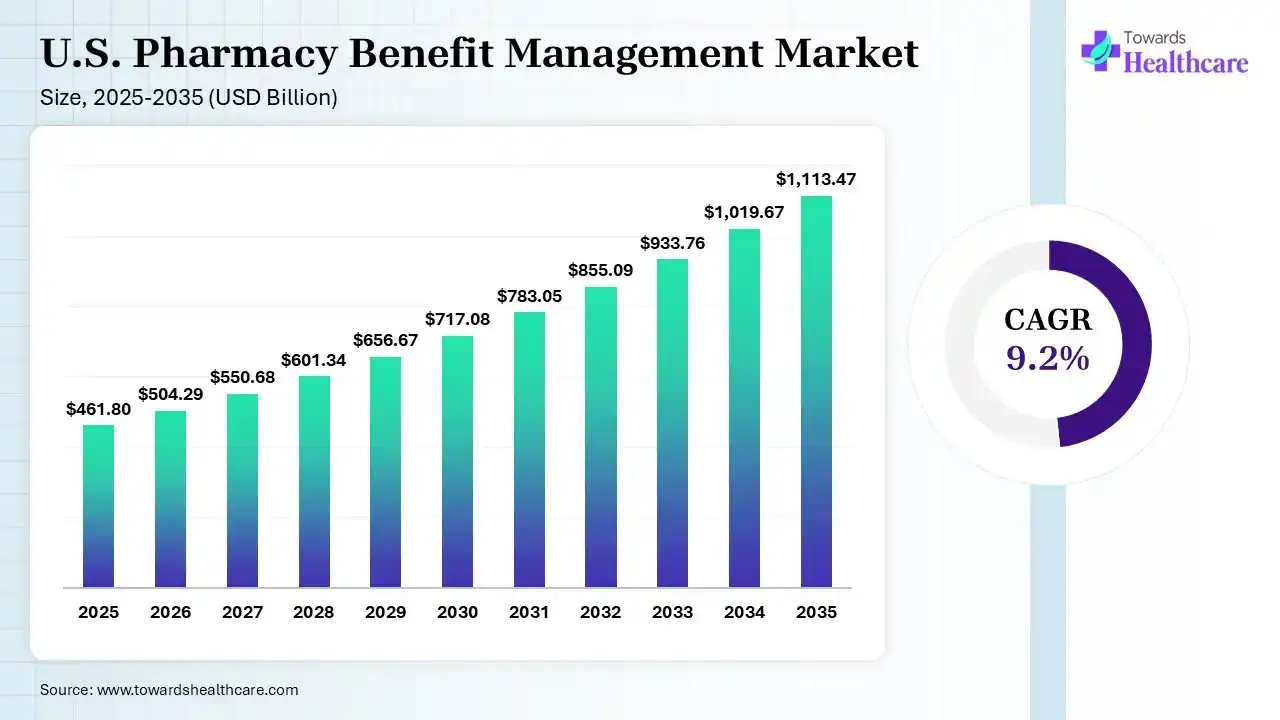
The U.S. pharmacy benefit management market was valued at USD 461.80 billion in 2025, is estimated at USD 504.29 billion in 2026, and is projected to reach USD 1113.47 billion by 2035, expanding at a CAGR of 9.2% from 2026 to 2035, driven by rising specialty-drug spending and growing demand for pharmacy cost management.
Prescription drug spending provides a clear view of the role of pharmacy benefit managers in the U.S. healthcare system. In 2024, prescription drug spending reached USD 467 billion and is expected to continue increasing through 2033. Prescription volumes are likely to grow at a slower pace, but the value of each prescription is rising due to the growing use of specialty medicines, biologics, GLP-1 therapies, and other high-cost treatments.
The report measures the market using three key factors. First, it assesses the prescription drug spending managed by pharmacy benefit managers. Second, it measures the number of prescriptions handled through pharmacy benefit manager networks. Third, it evaluates the revenue and economics of pharmacy benefit manager services. This approach avoids treating the full value of medicines processed through pharmacy benefit managers as pharmacy benefit manager revenue.
The base case assumes steady growth in prescription drug spending through the early 2035s, with specialty medicines and high-cost therapies accounting for a large share of the increase. The upside case assumes broader adoption of specialty drugs and continued expansion of high-cost therapies. The downside case considers greater use of lower-cost alternatives, tighter controls on drug utilization, lower rebates, and regulatory changes that could affect pharmacy benefit manager revenue and payment models.
The market is segmented by customer type, including employers, Medicare Part D, Medicaid, government programs, labor unions, and other large purchasers. It is also segmented by prescription drug channel, including retail pharmacies, mail-order pharmacies, and specialty pharmacies, as well as by drug type, including traditional generics, branded drugs, and specialty drugs.
Commercial accounts remain important as employers seek greater pricing transparency, predictable PMPM economics, and measurable savings. Medicare Part D is also becoming increasingly important as recent reforms change plan liability and patient cost-sharing. The Medicare Part D out-of-pocket limit is USD 2,100 in 2026, compared with USD 2,000 in 2025.
Specialty drugs remain a key segment despite traditional generics accounting for most prescriptions by volume. This reflects a shift in the market toward managing fewer prescriptions with significantly higher costs, particularly as specialty medicines continue to expand.
The main forces shaping the market include rising specialty drug costs, wider use of GLP-1 therapies, growing adoption of biosimilars, drug switching, employer demand for greater pricing transparency, Medicare changes, and increased regulatory oversight.
The gap between list prices, net prices, rebates, and pharmacy costs is creating more pressure across the drug pricing system. These factors also affect the final amount paid by patients. As a result, PBMs are moving beyond claims processing and taking a more active role in managing drug access, formularies, and pharmacy costs.
Vertical integration remains an important feature of the PBM market. In 2024, 69% of Medicare Part D beneficiaries in the U.S. were enrolled in plans affiliated with PBMs. PBM markets are also highly concentrated at the local level, with 94% classified as concentrated in 2024.
The report examines how vertical integration affects formulary decisions, specialty pharmacy management, pharmacy network economics, manufacturer contract negotiations, and customer retention.
PBM pricing is based on several components, including PMPM fees, administrative fees, rebate retention, spread pricing, pharmacy reimbursement, specialty pharmacy margins, and net drug costs.
Traditional pricing models typically combine service fees with manufacturer rebates or use the difference between payments from plan sponsors and reimbursements to pharmacies. Alternative models include fixed PMPM fees and full or partial rebate pass-throughs.
The economic impact of PBM pricing can be significant. An industry analysis published in 2025 reported a 7% managed drug cost trend for 2024, while overall prescription drug spending was growing at more than 10%. In another client example, net plan cost per member per month fell from USD 67.10 to USD 35.90 after switching PBMs. This is a client-specific result rather than an industry benchmark, but it illustrates how formulary decisions and pharmacy network design can affect plan costs.
The report benchmarks PMPM fees, rebate rates, specialty pharmacy margins, pharmacy reimbursement models, spread pricing economics, and net drug cost performance.
As prescription drug use has increased, the number of prescriptions filled each year has reached the billions. This has created two distinct demand patterns. Traditional prescriptions mainly require scale, broad coverage, efficient processing, and automated dispensing. Specialty prescriptions, by contrast, require greater clinical oversight, patient support, specialized distribution, and closer management of drug use.
The report examines how prescription demand is matched by the capacity of PBM networks, specialty pharmacies, mail-order pharmacies, pharmacists, and technology systems. It also identifies areas where demand is outpacing available capacity and where additional infrastructure or service capacity may be needed.
PBM Value Chain includes manufacturing companies, rebaters, PBMs, insurance firms, employers, pharmacies, specialty pharmacies, customers, and governmental programs.
The analysis covers value creation and extraction across four points in the value chain: contract manufacturing, formularies, pharmacy reimbursement, and specialty dispensing.
Vertical integration can improve operational coordination but may also create potential conflicts of interest and raise concerns about incentives across affiliated businesses.
The full report traces money flows, rebate flows, prescription flows, and information flows and evaluates margin opportunities at each stage of the value chain.
Technology is changing how PBMs operate, with systems moving from batch-based claims processing toward real-time eligibility and benefit checks. These systems can support healthcare utilization forecasting, automated treatment authorization, adherence monitoring for specialty drug programs, fraud detection, health data analysis, and personalized benefit design.
Artificial intelligence and advanced analytics are becoming increasingly important in PBM operations. They can help identify high-cost patients, improve formulary management, and forecast prescription volumes. Cloud-based platforms are also lowering technology barriers for smaller PBMs, allowing them to access capabilities that were once available mainly to larger organizations.
The report evaluates PBM technology based on system configuration, automation levels, analytics capabilities, physician decision support, data availability, member use of digital tools, and investment in new technologies.
Regulatory scrutiny of PBMs is focused on rebates, pharmacy reimbursement, spread pricing, vertical integration, self-dealing, contract transparency, and patient affordability.
Regulatory attention has increased as concerns have grown over the financial relationships between PBMs and affiliated pharmacies. One analysis found that affiliated pharmacies received 68% of their dispensing revenue from PBMs in 2023, up from 54% in 2016. Another study estimated that dispensing revenue for 51 specialty generic drugs exceeded acquisition costs by USD 7.3 billion between 2017 and 2022, along with approximately USD 1.4 billion in spread pricing revenue for these drugs.
Medicare drug-price negotiations are another major policy change. Negotiated prices for the first 10 Medicare Part D drugs took effect in 2026, with additional drugs expected to be included in future negotiation rounds.
The primary customers include employers, health insurers, government programs, unions, and other plan sponsors. All these customers highly value price, rebates, flexibility, reporting of specialty drugs management, member experience, and transparency of contracts during purchasing decisions.
Negotiating capabilities are strong among large employers due to their size, while smaller employers become an increasing target for PBMs, who provide pricing capabilities and technology. This study focuses on customer concentration, contract terms, switching costs, and consulting capabilities.
The U.S. PBM market is one of the most concentrated healthcare intermediaries markets. In 2024, the top four firms controlled 75% of the national market share. Express Scripts' market share rose from 17% in 2022 to 23% in 2024. CVS Caremark fell from 21% to 18%. OptumRx gained 23%. Prime Therapeutics gained 11%.
Another claims-based view would have Express Scripts with 30%, CVS Caremark with 27%, and OptumRx with 23% in 2024, controlling about 80% of U.S. prescription claims. The difference between the two sets of estimates is in the definitions and measurement approaches used. The full report goes through these differences, which cannot really be quantified as exactly as we pretend.
Scale winners take advantage of claims data, national pharmacy network, manufacturer relationships, and specialty capabilities. Challenger PBMs rely on pricing, simplicity, customization, and technology.
The following universe is designed specifically for the U.S. PBM market and includes scaled integrated PBMs, independent PBMs, transparent challengers, and specialist platforms.
| Company | Headquarters | Market Position | Core Strength | Major Applications or Segments |
| OptumRx | Minnesota, USA | Market leader | Scale and integration | Commercial, Medicare |
| Express Scripts | Missouri, USA | Market leader | Claims scale and specialty | Commercial, government |
| CVS Caremark | Rhode Island, USA | Market leader | Retail and specialty integration | Commercial, Medicare |
| Prime Therapeutics | Minnesota, USA | Large challenger | Health plan ownership model | Commercial, Medicare |
| Humana Pharmacy Solutions | Kentucky, USA | Major specialist | Medicare integration | Medicare |
| MedImpact Healthcare Systems | California, USA | Large independent | Independent PBM platform | Commercial, government |
| CarelonRx | Indiana, USA | Major integrated PBM | Payer integration | Commercial, Medicare |
| Navitus Health Solutions | Wisconsin, USA | Major transparent PBM | Pass-through model | Employer, government |
| PerformRx | Pennsylvania, USA | Regional and national challenger | Health plan services | Medicaid, Medicare |
| Capital Rx | New York, USA | Technology challenger | Cloud-based PBM platform | Employer, health plan |
| RxBenefits | Texas, USA | Employer specialist | Benefits administration | Employer |
| SmithRx | California, USA | Transparency challenger | Transparent pricing | Employer |
| Liviniti | Louisiana, USA | Independent PBM | Transparent benefit design | Employer |
| Rightway | New York, USA | Digital challenger | Navigation and advocacy | Employer |
| ProCare Rx | Georgia, USA | Independent PBM | Flexible PBM services | Employer, health plan |
| MedOne | Lowa, USA | Independent PBM | Employer pharmacy benefits | Employer |
| BeneCard PBF | New Jersey, USA | Independent PBM | Employer and government | Employer, public sector |
| EmsanaRx | Illinois, USA | Emerging PBM | Alternative PBM model | Employer |
| Prescryptive Health | Washington, USA | Technology specialist | Digital pharmacy infrastructure | Employer, pharmacy |
| Prodigy Rx | Texas, USA | Independent specialist | Pharmacy benefit services | Employer |
The top three PBMs collectively handle around 70%-80% of prescription volume, depending on the measure used. Optum Rx generated an estimated USD 154.7 billion in revenue in 2025, while adjusted prescriptions increased to 1.66 billion from 1.62 billion in 2024. Its operating income reached USD 7.2 billion in 2025.
Evernorth reported USD 219.4 billion in health services revenue in 2025, including network, home delivery, and specialty pharmacy activities. This highlights the scale of pharmacy-related economics within a vertically integrated healthcare business.
Humana reported USD 1.2 billion in 2025 revenue from pharmacy solutions provided outside its affiliated companies, up 34.7%. Pharmacy solutions provided within its own operations generated USD 11.7 billion.
The competitive analysis considers claims volume, managed lives, prescription volume, revenue exposure, and specialty pharmacy exposure to assess the position of major PBMs.
The leading integrated PBMs boast the highest combination of claims scale, national networks, specialty pharmacy assets, and manufacturer contracting leverage. Independent disruptors may offer more transparent rebate treatment, less restrictive contract terms, reduced administrative fees, and a higher degree of customization to individual clients’ requirements.
The report evaluates the key metrics of interest to a majority of payers, including revenue, claims, lives, specialty exposure, growth, operating profits, technology, network coverage, geographical reach, customer concentration, and strategic investment.
Large PBMs offer services such as formulary management, claims processing, retail network, mail order, specialty pharmacy, clinical programs, prior authorizations, adherence programs, and analytics to pharmacy benefit managers. On the other hand, small rivals offer transparency, employer-specific solutions, or selective specialty services.
The report analyzes the performance of the companies in traditional pharmacy benefits, specialty pharmacies, mail order, clinical management, utilization management, digital, and employer solutions.
The challengers are using their transparency in comparison with the existing legacy claims adjudication, which is characterized by a lack of transparency and real-time benefits processing. The research points out the market disruption by Capital Rx, SmithRx, Liviniti, and other innovative PBMs.
The report examines the competitive position of the Pharmacy Benefit Managers in various segments of healthcare. It analyzes the platforms of the companies for their automation, analytics, member tools, clinical operations, integration, and investment in technologies.
Employer commercial plans remain the dominant sector for PBM competition, whereas Medicare provides both opportunity and complexity. Specialty Pharmacy is an important strategy for a business as a few prescriptions can make up a significant portion of pharmacy spending.
The report profiles organizations in employer benefits, Medicare, Medicaid, specialty pharmacy, retail network, mail order, and high-cost therapeutic sectors.
Nationally operating PBMs have access to pharmacy networks and scale from manufacturers, but local market concentration is high. 94% of PBM local markets were highly concentrated in 2024.
The report examines the geographical footprint, regional market share, pharmacy network coverage, specialty distribution, and growth opportunities of major U.S. regions.
The capacity of the PBMs is linked to the ability to process claims, provide specialty fulfillment services, mail order capacity, pharmacists, and other assets, capabilities for distribution, and technology capacity, but not the manufacturing capacity.
The report will assess the dispensing center capacity, specialty fulfillment center capacity, automation, fulfillment capacity, digital capacity, and investment plans.
The large customers tend to look at the PBM performance in terms of net cost, rebate pass-through, pharmacy access, specialty management, clinical performance, and transparency of reporting. The transition costs may be high, as any change in formulary, claims processing system, pharmacy network, and member communications requires changes.
The assessment includes an analysis of direct employer sales, consultant presence, relationship with the health plans, government contracting, pharmacy network, and customer retention characteristics.
The current strategy is focused on specialty growth, transparency in benefits models, technology investments, employer products, biosimilars, digital, and control over expensive drugs.
The report will monitor key products, contracts, investments, alliances, specialty growth, and geographical shifts of the last two to three years.
Increasingly, PBM transactions seek specialty pharmacy, technology, transparent benefit administration, clinical services, and exposure to employer clients.
The report analyzes acquisitions by value, target capability, strategic logic, client exposure, and integration potential.
Special emphasis is placed on acquisitions that lead to vertical integration and greater control of specialty drug economics.
Company profiles include the same 20+ firms in terms of corporate headquarters, ownership, employees, lives managed, claims exposure, revenue, growth, profitability, product lines, specialty capabilities, technology, customers, geographies, pharmacy network, strategic investments, and competitive advantages.
The public filings make clear that the scale differences are significant. A top platform company had 1.66 billion adjusted prescriptions in 2025, while transparent rivals build their businesses from much smaller but rapidly growing employer pools.
The market separates into several strategic groups.
The analysis identifies which companies have the strongest position based on scale, growth, transparency, technology, specialty capabilities, and customer alignment.
A number of good white spaces can be found in the market. They include transparent PBMs for midsize employers, specialty cost management, biosimilars optimization, GLP 1 utilization management, real-time benefits tools, independent pharmacy friendly reimbursement, transparent rebate model, and technology-enabled formulary management.
Opportunity is measured using managed lives, PMPM spending, penetration gap, and addressable prescription volume.
The market will continue to remain compelling given that prescription spending is sizeable, frequent, and inherently complicated. Nevertheless, the economics here favor firms that possess scale, unique technology, specialty capabilities, or transparency in their operations.
The most compelling areas are specialty spend management, transparency for employers, biosimilars, GLP-1 spend management, analytics, and technology-enabled PBM operations.
Prescription drug spending is forecasted to go up until 2030 and even 2035, although its composition will change. Incremental prescription spending is predicted to be mainly composed of specialty, obesity, oncology, immunology, rare disease, and complex chronic therapy spending.
The base case scenario sees continued industry consolidation and market growth staying at moderate levels. Upside scenarios are biased towards rapid uptake of specialty and managed services by PBMs, while the downside scenario is tilted towards increasing generic spending, unfavorable rebate economics, and regulation.
Medicare negotiations will progressively shape the economic realities of high-cost-to-value therapies. Ten high-cost therapies were negotiated within the Part D program for this year, with fifteen more to be negotiated and priced in 2026. In 2027, negotiations and pricing will take place on another fifteen therapies, with future winners needing to find the right balance between scale, favorable economics, analytics, and payer relationships. For payers, the question is not one of horsepower; it is rather one of controlling the total net cost while still having access and value.
By PBM Service Type
By Payer Type
By Prescription Type
By Pharmacy Channel
By Customer Type
By PBM Business Model
By Revenue Model
By Specialty Pharmacy Category
By Therapeutic Area
By Technology
By Market Structure
By Customer Engagement Channel


Principal Consultant
Payal Rabde is a Healthcare Market Research Analyst at Towards Healthcare Research & Consulting with 4+ years of experience in pharmaceuticals, biotechnology, medical devices, and life sciences.
Learn more about Payal Rabde

Reviewed By
Aditi Shivarkar is a seasoned professional with over 14 years of experience in healthcare market research. As a content reviewer, Aditi ensures the quality and accuracy of all market insights and data presented by the research team.
Learn more about Aditi Shivarkar