

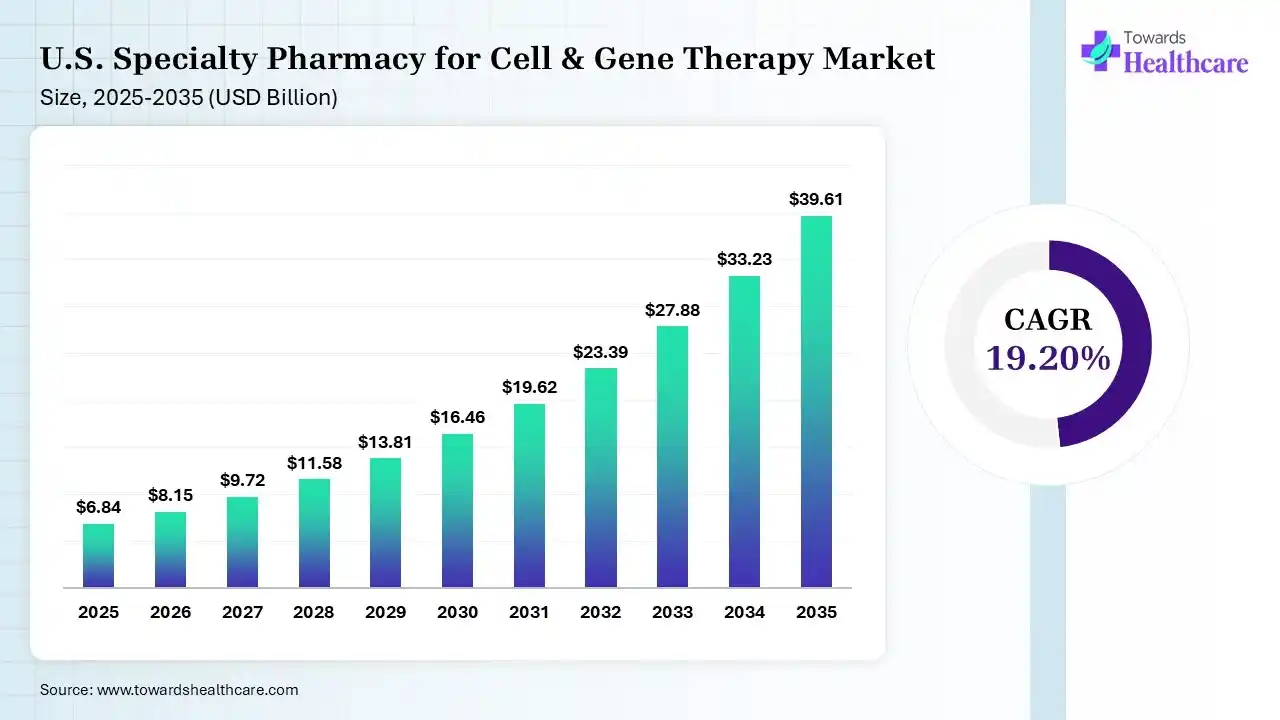
The U.S. specialty pharmacy for cell & gene therapy market size was estimated at USD 6.84 billion in 2025 and is predicted to increase from USD 8.15 billion in 2026 to approximately USD 39.61 billion by 2035, expanding at a CAGR of 19.20% from 2026 to 2035. Her analysis highlights that the U.S. specialty pharmacy for cell & gene therapy market is rapidly expanding due to rare-disease pipeline expansion, increasing specialty distributors, growing applications, shift towards Medicaid payers, and the presence of key industry players like Bristol Myers Squibb, Johnson & Johnson, and Legend Biotech.
The U.S. specialty pharmacy for cell & gene therapy refers to a wide range of services for delivering advanced therapies to patients across the U.S. They encompass services like distribution, patient access, clinical management, and specialized logistics services. The different types of therapies delivered include CAR-T, TCR-T, NK cell, in vivo gene, ex vivo gene, and gene-editing therapies. They help in targeting different types of diseases like rare genetic diseases, oncology, hematology, ophthalmic, neurological, autoimmune, and metabolic indications. Furthermore, the therapies, indications, distribution channels, services, site of care, payers, therapy administration, regulatory developments, and buyer and consumer intelligence are also covered in this report.

As the market research analyst, I interpret that the infographic stat panel illustrates market definition and sizing metrics. The total U.S. specialty-drug spending was reported to be $263 billion, with specialty medicines accounting for a 54% share of all pharma spending. The U.S. specialty pharmacy for CGT market size was reported to be $6.84 billion in 2025, which is expected to increase by 19.2% CAGR during 2026-2035.
Key Insight:
The $6.84 billion CGT-specific specialty-pharmacy figure and $263 billion broader specialty-drug spending ecosystem reflect a rapidly growing sub-segment of an already dominant pharmaceutical category.
Source: Towards Healthcare, U.S. Specialty Pharmacy for Cell & Gene Therapy Market Model, 2025; HHS analysis of specialty-drug spending, as cited in supplied data.
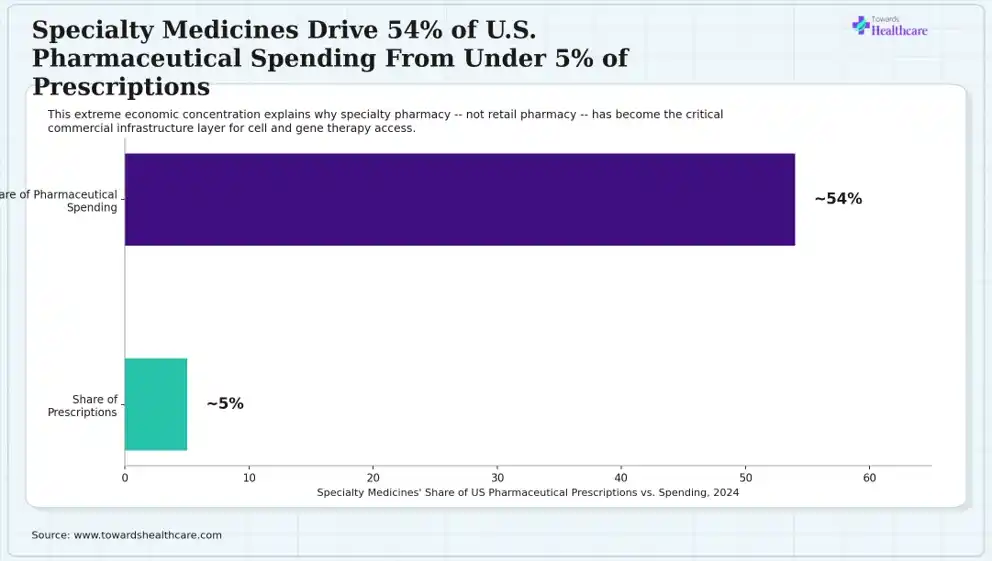
Based on our research, the horizontal bar chart compares specialty medicines' share of prescriptions and spending. U.S. prescriptions from specialty medicines accounted for approximately a 5% share, while U.S. pharmaceutical spending from specialty medicines contributed to nearly a 54% share.
Key Insight:
The manufacturers, payers, and health systems all treat specialty pharmacy infrastructure as strategically disproportionate to its prescription volume due to the presence of approximately an 11-to-1 ratio between specialty medicines' spending share and prescription share.
Source: HHS analysis of specialty-drug spending, 2022–2024, as cited in supplied data.
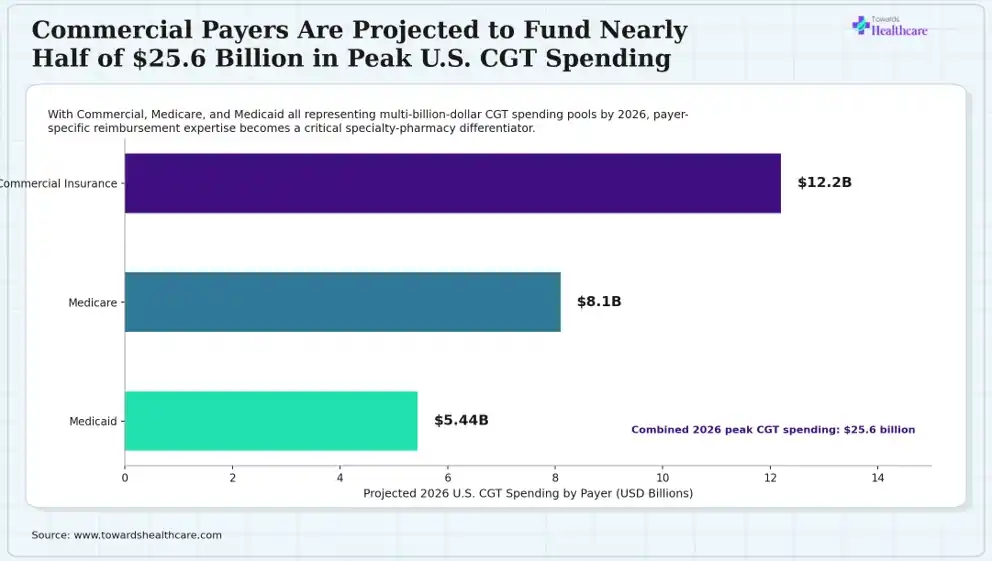
The given horizontal bar chart represents projected 2026 U.S. CGT spending by payer. Projected 2026 CGT spending for commercial insurance is expected to reach $12.2 billion, Medicare is anticipated to reach $8.1 billion, and Medicaid is projected to reach $5.44 billion. Thus, the combined total of projected 2026 CGT spending is anticipated to be $25.6 billion.
Key Insight:
With Medicaid surpassing 21% of projected 2026 CGT spending, it is essential for specialty pharmacies serving state Medicaid populations to navigate different reimbursement and prior-authorization processes instead of focusing only on commercially insured patients.
Source: Towards Healthcare, TAM/SAM/SOM analysis, 2025, citing published CGT spending projections by payer.
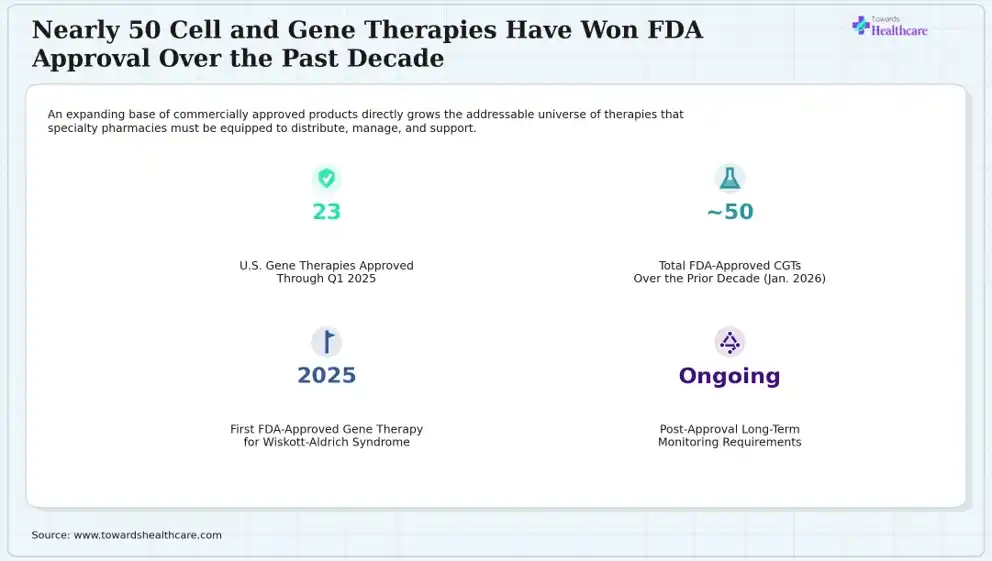
As per the analysis, the infographic stat panel covers FDA CGT approval pipeline metrics. A total of 23 U.S. gene therapies were approved through Q1 2025, and the same year recorded a regulatory milestone that is the introduction of the first FDA-approved gene therapy for Wiskott-Aldrich syndrome. As of January, approximately 50 FDA-approved CGTs over the prior decade were recorded, while the ongoing regulatory requirements are focusing on post-approval long-term safety and efficacy monitoring.
Key Insight:
With the expanding pipeline approaching 50 approved products within a single decade, this suggests that specialty pharmacy CGT infrastructure should focus on product diversity across dozens of distinct handling, storage, and administration protocols rather than a handful of flagship therapies.
Source: Towards Healthcare, TAM/SAM/SOM analysis, 2025, citing FDA approval data through Q1 2025 and January 2026.
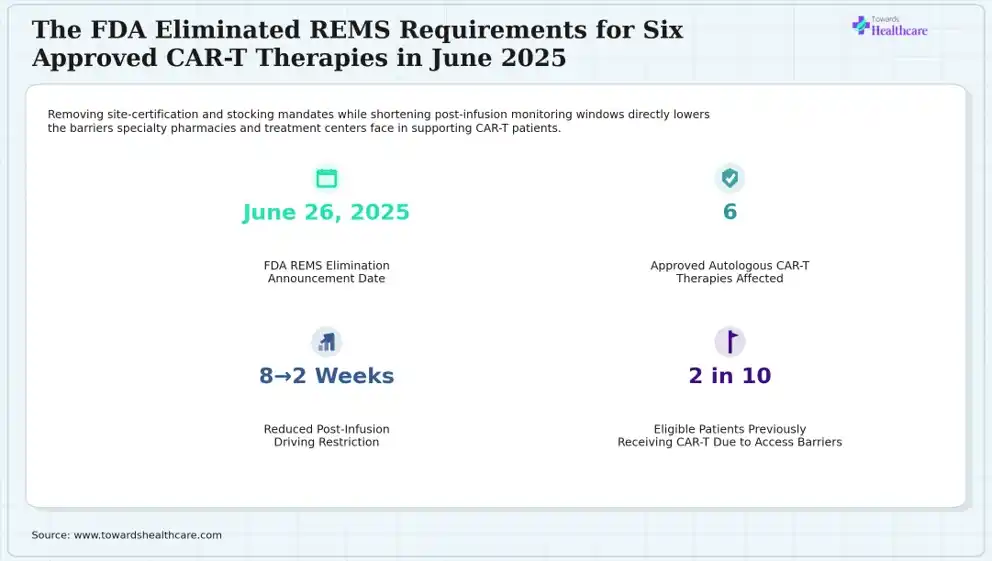
Based on the information gathered, the infographic stat panel highlights FDA REMS elimination regulatory metrics. On June 26, 2025, the FDA announced REMS elimination, which reduced the post-infusion driving restriction from 8 weeks to 2 weeks. This affected 6 approved autologous CAR-T therapies, namely Abecma, Breyanzi, Carvykti, Kymriah, Tecartus, and Yescarta, while the prior estimated share of eligible patients receiving CAR-T is reported to be approximately 2 in 10.
Key Insight:
Due to the hematology/oncology community's accumulated clinical experience, the FDA suggested REMS is no longer necessary, directly validating specialty pharmacies' and treatment centers' based on years of safety-management infrastructure investment in CAR-T administration.
Source: FDA, “FDA Eliminates Risk Evaluation and Mitigation Strategies (REMS) for Autologous Chimeric Antigen Receptor CAR T Cell Immunotherapies,” June 27, 2025; BioPharm International, June 2025.
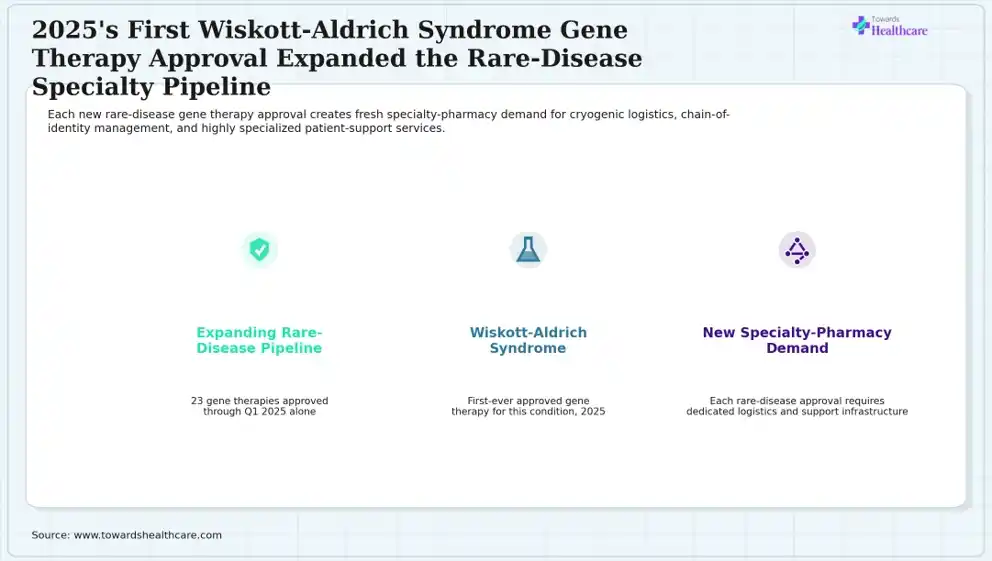
The above-mentioned ecosystem infographic focuses on rare-disease gene therapy pipeline expansion. The expansion of the rare-disease pipeline includes 23 gene therapies approved through Q1 2025 alone. It also includes the first-ever approved gene therapy for Wiskott-Aldrich syndrome in 2025. Additionally, the new specialty-pharmacy demand is driven by rare-disease approvals requiring dedicated logistics and support infrastructure.
Key Insight:
The approval of therapy for Wiskott-Aldrich syndrome highlights that the specialty-pharmacy addressable market continues to expand into progressively rarer, more specialized genetic conditions beyond its original oncology and hematology applications.
Source: Towards Healthcare, TAM/SAM/SOM analysis, 2025, citing 2025 FDA approval data.
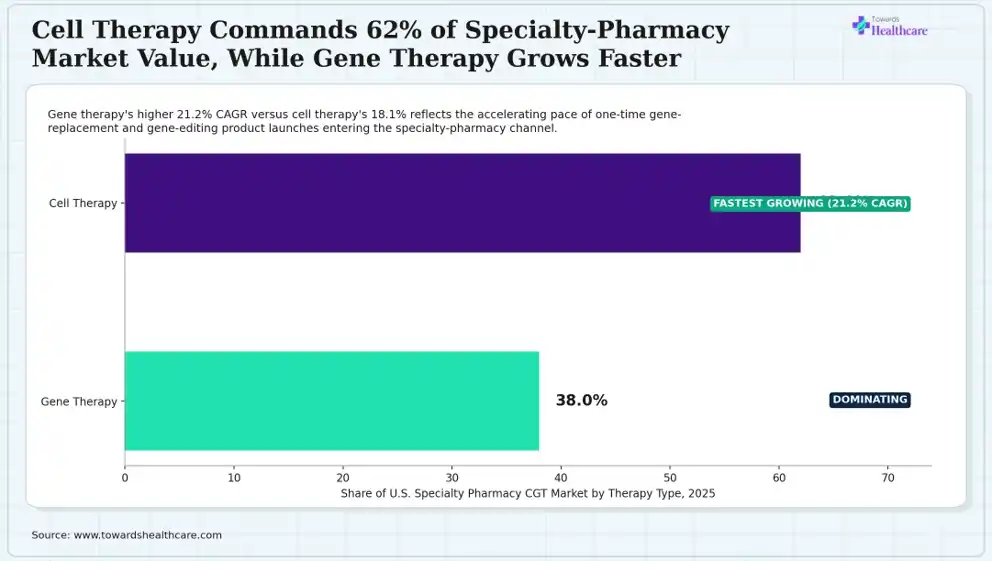
According to the survey conducted, the horizontal bar chart highlights U.S. specialty pharmacy CGT market share by therapy type in 2025. The cell therapy segment held the largest market share of 62.0% and is expected to grow at an 18.1% CAGR during the forecast period. The gene therapy segment held a 38.0% share in 2025 and is expected to show the highest CAGR growth of 21.2% during the upcoming years.
Key Insight:
The therapy-type split could approach parity well before the end of the ten-year forecast window due to the rapid expansion of gene therapy's contribution to more than a third of market value, launching more recently than CAR-T cell therapy.
Source: Towards Healthcare, U.S. Specialty Pharmacy for Cell & Gene Therapy Market Model, 2025.
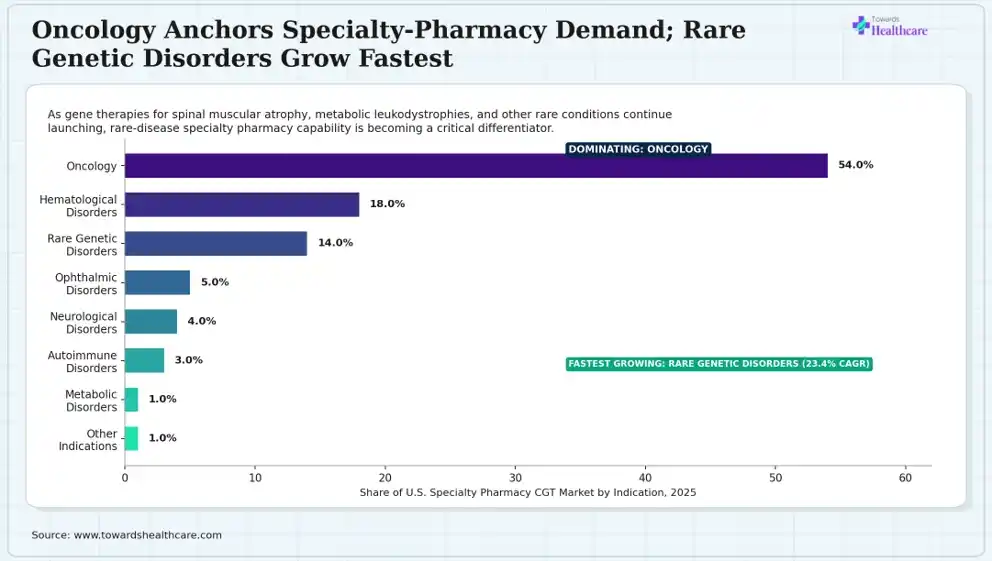
As the market research analyst, I interpret that the horizontal bar chart reflects U.S. specialty pharmacy CGT market share by indication in 2025. The oncology segment dominated the market with 54% in 2025, while the hematological disorders segment held the second-largest share of 18.0% in 2025. The rare genetic disorders segment held a 14% market share and is expected to grow at a 23.4% CAGR during the forecast period, while the ophthalmic disorders segment accounted for a 5% market share. The neurological disorders segment held 4.0%, while the autoimmune disorders segment held 3% and is expected to show the fastest growth at 25.1% CAGR during the predicted time. The metabolic disorders segment contributed to 1% market share in 2025, while the other indication segment was reported to hold 1% share in 2025.
Key Insight:
The autoimmune disorders segment is the fastest-growing indication, with a 25.1% CAGR, which encourages specialty pharmacies to focus on developing autoimmune-specific CGT capability ahead of that segment reaching meaningful scale.
Source: Towards Healthcare, U.S. Specialty Pharmacy for Cell & Gene Therapy Market Model, 2025.
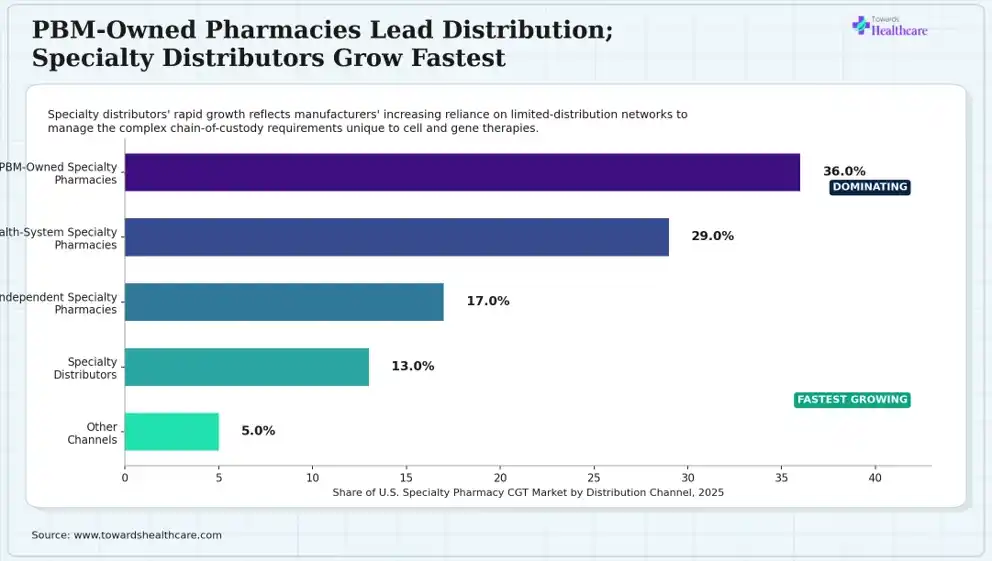
Based on our research, the horizontal bar chart outlines the U.S. specialty pharmacy CGT market share by distribution channel in 2025. Based on distribution channel type, the PBM-owned specialty pharmacies segment dominated the market with a 36.0% share in 2025 and is expected to expand to 17.4% during the forecast period. The health-system specialty pharmacies segment held 29.0% in 2025, while the independent specialty pharmacies segment accounted for 17.0% market share. The specialty distributors segment held 13.0% share in 2025 and is anticipated to expand rapidly with 23.1% CAGR during the predicted period. The other channels segment held 5.0% share of the market in 2025.
Key Insight:
The limited-distribution network structures purpose-built for CGT chain-of-custody requirements are conquering the general-purpose PBM infrastructure, promoting expansion of specialty distributors at nearly 6 percentage points faster than the market-leading PBM-owned channel.
Source: Towards Healthcare, U.S. Specialty Pharmacy for Cell & Gene Therapy Market Model, 2025.
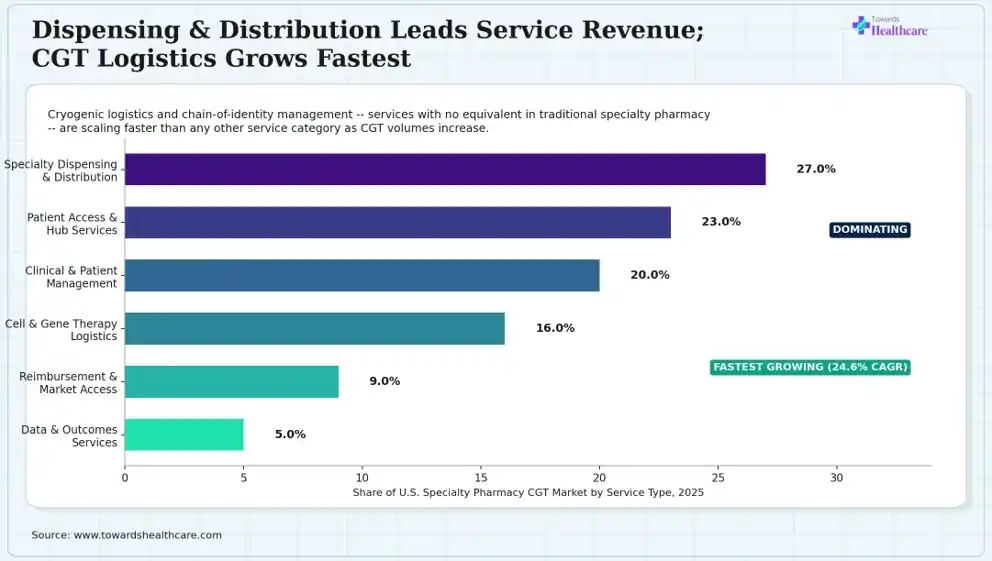
The given horizontal bar chart covers U.S. specialty pharmacy CGT market share by service type in 2025. The specialty dispensing & distribution segment held the major share of 27.0% of the market in 2025, while the patient access & hub services segment held the second-largest share of 23.0%. The clinical & patient management segment held a 20% market share in 2025, which was followed by the cell & gene therapy logistics segment with a 16% share. The reimbursement & market access segment accounted for 9.0% market share, while the data & outcomes services segment held 5% share in 2025 and is expected to show the fastest growth rate with 25.3% CAGR during the upcoming year.
Key Insight:
The growing interest from payers in outcomes-based contracting is shifting the real-world evidence and outcomes-tracking capability from a nice-to-have into a core specialty-pharmacy competency, which is the major reason for the data & outcomes services segment's current smallest share and fastest CAGR growth
Source: Towards Healthcare, U.S. Specialty Pharmacy for Cell & Gene Therapy Market Model, 2025.
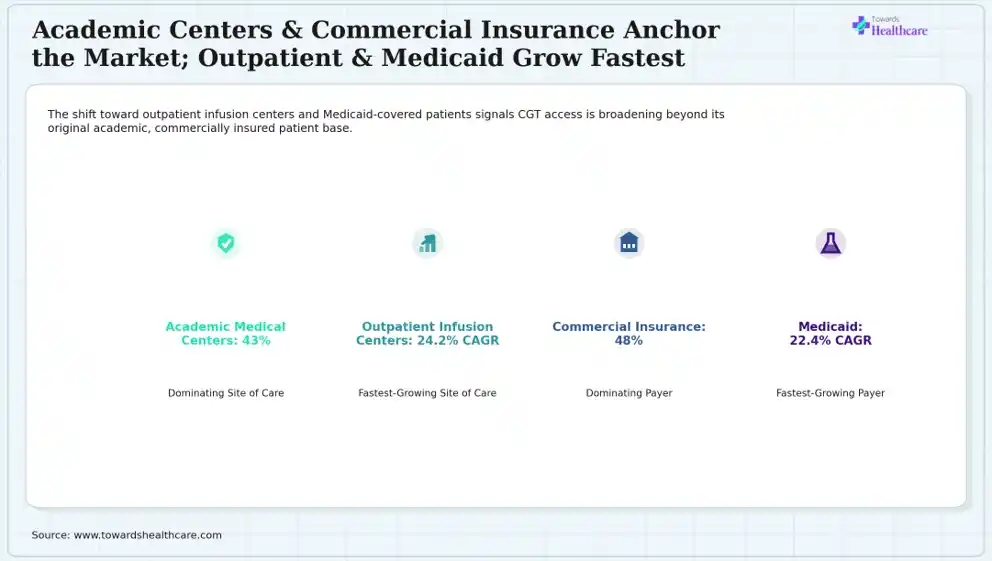
As per the analysis, the ecosystem infographic shows site-of-care and payer segment leaders. Based on the site-of-care category, the academic medical centers segment led the market with a 43.0% share in 2025, while the outpatient infusion centers segment is expected to grow with the fastest CAGR of 24.2% during the predicted period. As per the payer category, the commercial insurance segment registered dominance with a 48.0% share, whereas the Medicaid segment contributes to the fastest-growing 22.4% CAGR during the upcoming years.
Key Insight:
The regulatory simplification and site-of-care diversification are two sides of the same access-expansion trend, which is represented by the fastest-growing outpatient infusion centers aligning with the June 2025 REMS elimination that reduced monitoring requirements.
Source: Towards Healthcare, U.S. Specialty Pharmacy for Cell & Gene Therapy Market Model, 2025.
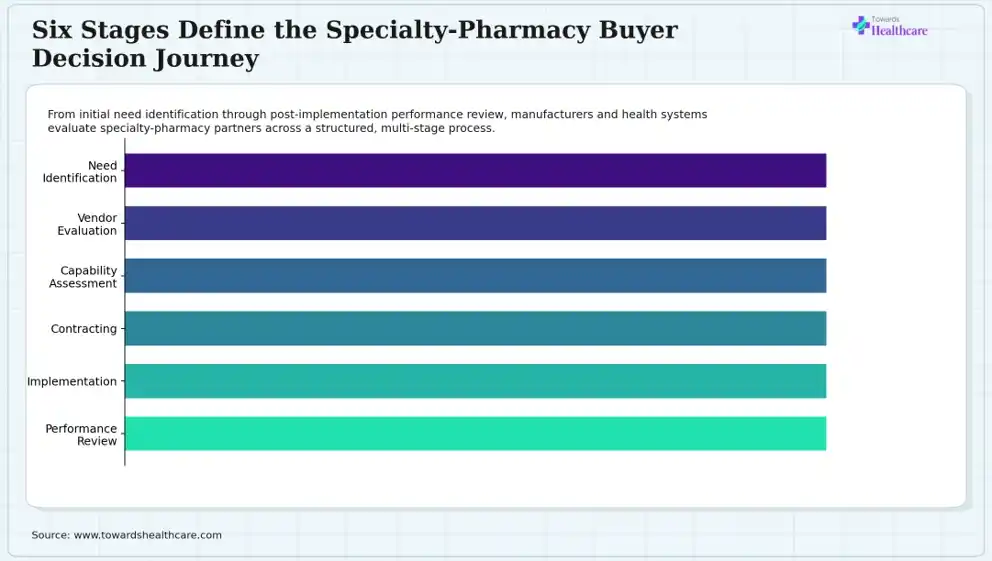
Based on the information gathered by Aman, the horizontal funnel chart focuses on the six-stage specialty-pharmacy buyer decision journey. The first stage that is need identification, focuses on the manufacturer or health system identifying a specialty-pharmacy service gap. The second stage, vendor evaluation, highlights that candidate specialty pharmacies are assessed against initial criteria. The third stage that is capability assessment, covers a deeper review of therapy handling, logistics, and technology capability. The fourth stage includes contracting, which focuses on formal agreement negotiation and execution. The fifth stage, implementation, highlights onboarding, systems integration, and operational launch. The sixth stage represents ongoing evaluation against service-level and outcomes benchmarks.
Key Insight:
The above-mentioned six-stage, structured decision journey revolves around the high stakes of CGT specialty-pharmacy contracting, rather than an ad hoc vendor selection, where the patient-specific therapeutic material can be directly compromised irreparably due to errors in chain-of-identity or cryogenic logistics.
Source: Towards Healthcare, U.S. Specialty Pharmacy for Cell & Gene Therapy Buyer Intelligence, 2025.
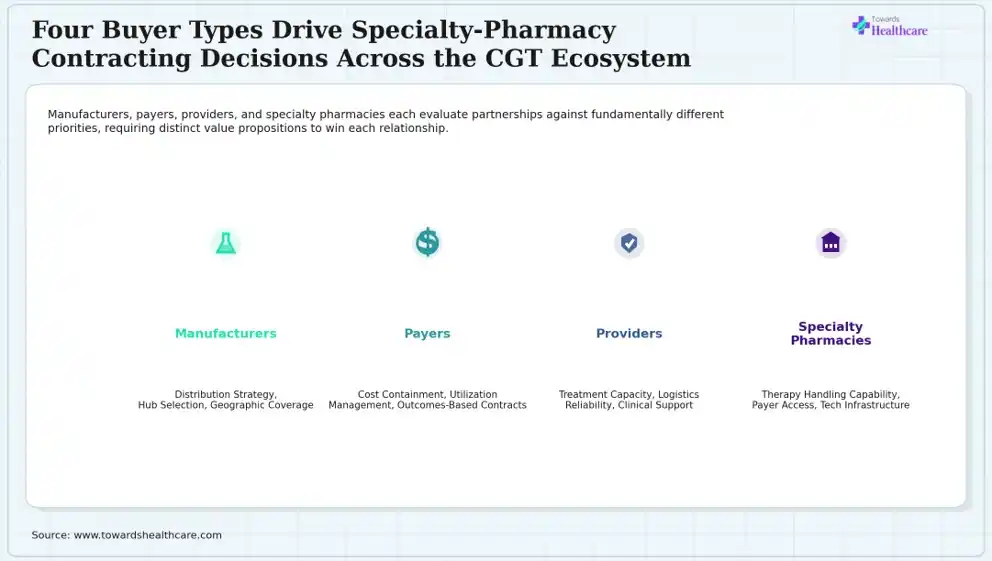
The above-mentioned ecosystem infographic covers four buyer types in the CGT specialty-pharmacy value chain. The manufacturers focus on distribution strategy, hub selection, and geographic coverage. The payers are driven by cost containment, utilization management, and outcomes-based contracting. The providers revolve around treatment capacity, logistics reliability, and clinical support. The specialty pharmacies aim for therapy handling capability, payer access, and technology infrastructure.
Key Insight:
With different priorities of manufacturers (distribution strategy) and payers (cost containment), the value proposition to a manufacturer can be irrelevant to winning a payer contract, which makes specialty pharmacy's focus separately go-to-market approaches for each buyer type.
Source: Towards Healthcare, U.S. Specialty Pharmacy for Cell & Gene Therapy Buyer Intelligence, 2025.
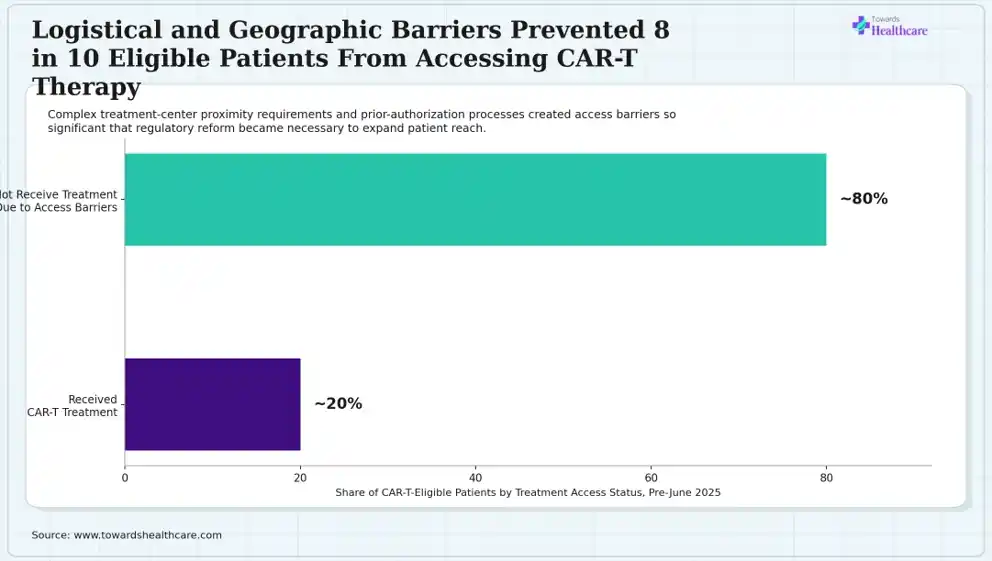
As per the analysis conducted by Aman, the horizontal bar chart highlights the share of CAR-T-eligible patients by treatment access status, pre-June 2025. Approximately 20% share of CAR-T-eligible patients received CAR-T treatment, while almost 80% share of patients did not receive treatment due to access barriers.
Key Insight:
A rare, quantified benchmark supporting the measurement of the real-world impact of June 2025's regulatory simplification is provided by the approximately 80% unmet-access figure disclosed by a CAR-T manufacturer in the context of the REMS elimination.
Source: BioPharm International, “Biopharm Industry Impacts of FDA Eliminating REMS for CAR-T Therapies,” citing manufacturer statement, June 27, 2025.
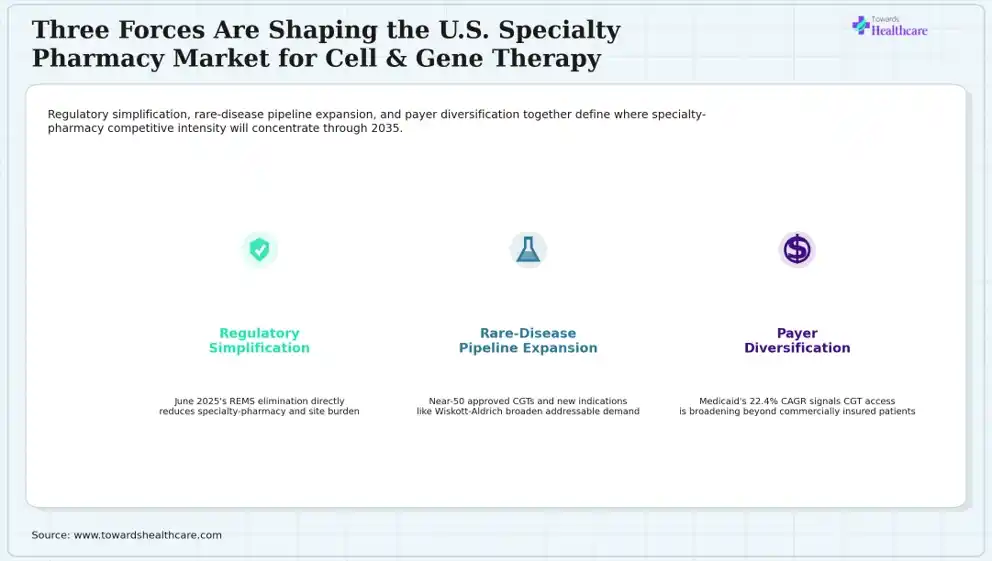
Based on the survey conducted by Aman, the synthesis infographic illustrates three structural forces shaping U.S. specialty pharmacy CGT competition. The regulatory simplification focuses on June 2025's REMS elimination, which directly reduced specialty-pharmacy and site burden. The rare-disease pipeline expansion highlights nearly 50 approved CGTs and new indications like Wiskott-Aldrich, broadening addressable demand. The payer diversification covers Medicaid's 22.4% CAGR, indicating CGT access is broadening beyond commercially insured patients.
Key Insight:
The regulatory simplification directly supports the site-of-care diversification (Image 11) and payer diversification essential to convert the pipeline expansion (Image 3 & 4) into treated patients, which reflects that these three forces reinforce one another instead of operating independently.
Through Q1 2025, the FDA approval was granted to 23 U.S. gene therapies, which further accounted for 50 approved cell and gene therapies over the prior decade.
Source: Towards Healthcare TAM/SAM/SOM analysis, 2025
On June 26-27, 2025, the FDA introduced the hematology/oncology community's established clinical experience by eliminating Risk Evaluation and Mitigation Strategies (REMS) for six approved BCMA- and CD19-directed autologous CAR-T cell therapies, namely Abecma, Breyanzi, Carvykti, Kymriah, Tecartus, and Yescarta.
Source: FDA press announcement; AABB, June 30, 2025
On June 27, 2025, the logistical and geographic barriers were reported to reduce access to the therapies to only 2 in 10 eligible patients, as per the CAR-T manufacturer, while the REMS elimination is expected to expand access to community health settings.
Source: BioPharm International, June 2025
In December 2025, the first-ever gene therapy for Wiskott-Aldrich syndrome was approved by the FDA, which resulted in expansion of the approved-CGT list into an additional rare genetic disease indication.
Source: Towards Healthcare TAM/SAM/SOM analysis, 2025
2026 (Projected), U.S. CGT spending is expected to achieve new heights by reaching $25.6 billion at its peak, with the three largest payer pools like Commercial insurance with $12.2B, Medicare with $8.1B, and Medicaid with $5.44B.
Source: Towards Healthcare TAM/SAM/SOM analysis, 2025
It is the developer of Abecma and Breyanzi, which are REMS-eliminated CAR-T products among 6 CAR-T products in June 2025, reducing monitoring requirements.
They were responsible for the development of Carvykti, a REMS-eliminated CAR-T product, among 6 CAR-T products with REMS eliminated in June 2025.
A well-known developer of Kymriah, the company's product was among 6 CAR-T products with REMS eliminated in June 2025.
Tecartus and Yescarta were developed by the company, which are the products among 6 CAR-T products with REMS eliminated in June 2025.
It is a federal regulator responsible for the elimination of REMS for 6 CAR-T products in June 2025, and it also approved the first Wiskott-Aldrich gene therapy in 2025, as well as granted approvals for approximately 50 CGTs over the prior decade.
Aditi is a cell and gene therapy research expert with strong experience in specialty pharmacies, cell & gene therapy logistics, and regulatory requirements. She conducted detailed market research, analyzed company data, clinical trends, and industry developments. Based on her comprehensive analysis, the following strategic key takeaways highlight the most important market insights and opportunities.
For Service Providers & CDMOs
For Pharma & Biotech Companies
For Investors & Corporate Strategy Teams
Based on my assessment, the market is expanding rapidly due to increasing applications of cell and gene therapies. The growth of specialty distributors is also increasing their accessibility. I also anticipate that the new collaboration among the major companies can accelerate their innovations and enhance access to their services. I also see strong growth in rare disease indications and logistics solutions, which will create new market opportunities.
Payal Rabde led the primary market research, developed the methodology, analyzed trends, segmentation, competition, forecasts, and strategic opportunities, forming the report's analytical foundation.
Aman was responsible for collecting and validating clinical trial data, research publications, company information, partnerships, and other quantitative datasets, strengthening evidence-based analysis and market estimations.
Aditi reviewed the complete research document, performed quality checks, validated findings, refined content, corrected inconsistencies, and finalized the report, ensuring accuracy, clarity, credibility, and publication-ready quality.
By Indication
By Distribution Channel
By Service Type
By Site of Care
By Payer
By Therapy Administration

















Principal Consultant
Payal Rabde is a Healthcare Market Research Analyst at Towards Healthcare Research & Consulting with 4+ years of experience in pharmaceuticals, biotechnology, medical devices, and life sciences.
Learn more about Payal Rabde

Reviewed By
Aditi Shivarkar is a seasoned professional with over 14 years of experience in healthcare market research. As a content reviewer, Aditi ensures the quality and accuracy of all market insights and data presented by the research team.
Learn more about Aditi Shivarkar