

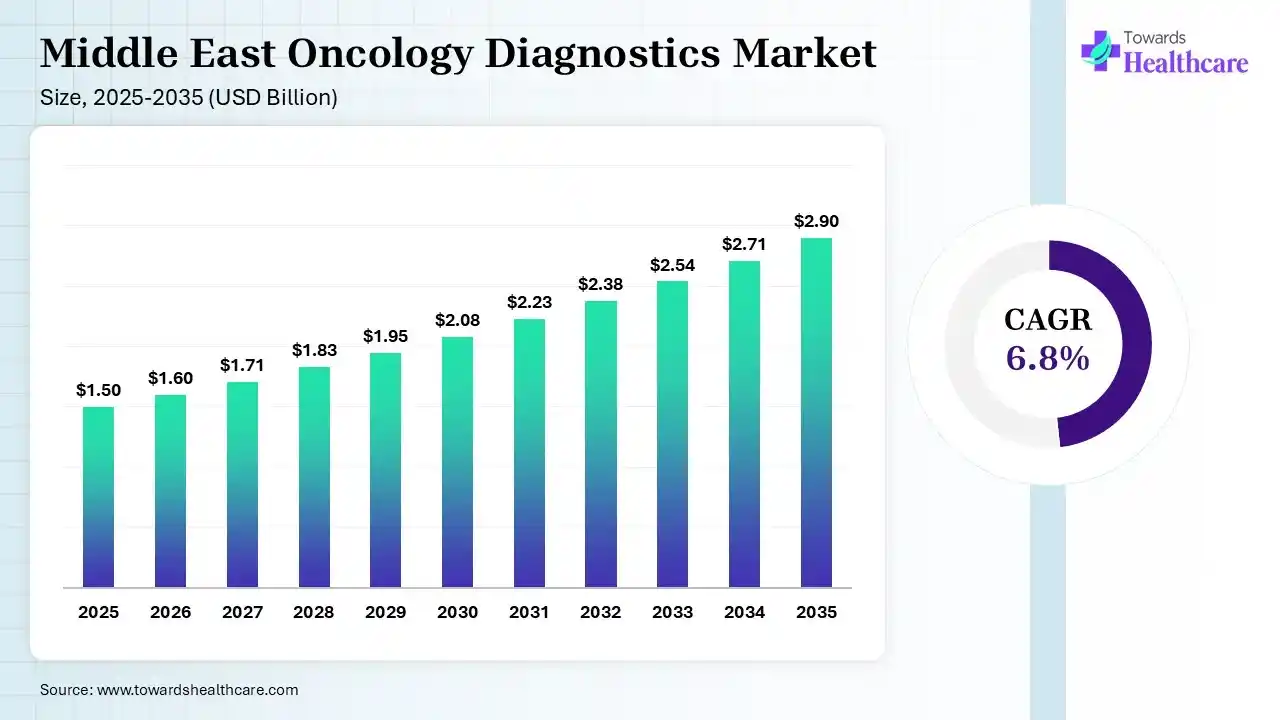
The Middle East oncology diagnostics market size was estimated at USD 1.5 billion in 2025 and is predicted to increase from USD 1.6 billion in 2026 to approximately USD 2.9 billion by 2035, expanding at a CAGR of 6.8% from 2026 to 2035. Analysis also highlights that the Middle East oncology diagnostics market is rapidly expanding due to the increasing incidence of various cancer cases, growing early disease detection, rising demand for minimally invasive testing solutions, increasing advancements in liquid biopsy-based detection, expansion of genomic testing services, increasing interest in molecular diagnostics, and growing collaborations.
Middle East oncology diagnostics refers to tests and methods used for the detection and monitoring of different types of cancers across the Middle East. They include a wide range of laboratory tests, biopsies, molecular tests, and imaging studies. These tests help in early cancer detection, monitoring their progression, accurate diagnosis, and treatment guidance.
Moreover, the Middle East oncology diagnostics market accounted for USD 1.50 billion in 2025 and is anticipated to rise at a 6.8% CAGR during the forecast period, which is driven by rising cancer incidence, healthcare investment, expansion of oncology infrastructure, molecular testing, advanced imaging, precision-medicine adoption, and increasing demand for earlier and more precise cancer diagnosis. The market is also shifting beyond conventional pathology and imaging toward genomic profiling, ctDNA monitoring, liquid biopsy, digital pathology, companion diagnostics, and AI-assisted diagnostic workflows.
Analyst View - Market Size
The rise in the transition from diagnosis based primarily on tissue pathology and conventional imaging toward multi-modal cancer diagnostics that combine pathology, molecular testing, genomic profiling, and advanced imaging is driving the market growth. Additionally, compared with several mature diagnostic categories, molecular diagnostics, liquid biopsy, and companion diagnostics have higher growth potential because they support treatment selection, recurrence detection, and response monitoring.
| Segment/Sub-segment | Market Share | CAGR | Growth Driver |
| Consumables | 58.00% | 7.10% | Rising cancer testing volumes increase recurring reagent consumption. Precision-oncology workflows expand demand for biomarker kits and antibodies. Automated laboratories increase throughput and repeat consumable utilization. |
| Antibodies | 15.00% | 6.50% | IHC remains important for tumor classification and biomarker evaluation. HER2, ER, PR, and other biomarker testing support demand. |
| Kits & Reagents | 27.00% | 7.60% | PCR and NGS adoption increases molecular assay-kit demand. Multiplex testing raises reagent utilization, while precision-medicine programs expand genomic testing. |
| Probes | 8.00% | 6.90% | ISH and molecular pathology require specialized probes, while biomarker-driven treatment selection expands utilization. |
| Assay Controls & Standards | 4.00% | 6.20% | Oncology laboratories require validated quality-control materials and consistent analytical controls. |
| Other Consumables | 4.00% | 6.40% | Broader diagnostic menus and new molecular platforms increase supporting laboratory consumable requirements. |
| Instruments | 32.00% | 6.40% | Cancer centers upgrade pathology and molecular laboratories, while automation improves throughput. |
| Pathology-Based Instruments | 11.00% | 6.00% | Digital pathology and automated tissue processing support replacement and modernization. |
| Molecular Diagnostic Instruments | 13.00% | 7.50% | NGS and PCR adoption accelerates precision-oncology testing and genomic-testing capacity. |
| Imaging Instruments | 8.00% | 5.80% | CT, PET and MRI remain central to diagnosis, staging and surveillance. |
| Services | 10.00% | 7.00% | Outsourcing and specialist reference laboratories expand access to complex oncology testing. |
| Diagnostic Testing Services | 4.00% | 6.70% | Hospitals increasingly use specialized external testing capacity. |
| Laboratory Services | 2.50% | 6.40% | Centralized laboratories improve utilization of expensive diagnostic platforms. |
| Genomic Testing Services | 2.50% | 8.20% | Precision oncology increases demand for comprehensive genomic profiling and biomarker testing. |
| Digital Pathology & Interpretation | 1.00% | 7.80% | Whole-slide imaging, remote pathology, and AI-supported interpretation expand digital workflows. |
As per our senior research analyst, Payal Rabde, the table covers different types of products along with their market share, CAGR, and growth drivers. The consumables segment held the largest share of 58% of the market in 2025, due to growth in cancer testing volumes, a rise in precision-oncology workflows that fueled the demand for biomarker kits and antibodies, and automated laboratories that increased throughput and repeat consumable utilization. The genomic testing services subsegment held 2.50% market share in 2025 and is expected to show the highest growth at 8.20% CAGR during the forecast period, due to increasing precision oncology driving demand for comprehensive genomic profiling, pharmacogenomic and biomarker testing expanding clinical applications, and reference laboratories enabling access without local NGS infrastructure.
Analyst View - Product
The dominance of the consumables segment with 58% market share highlights that every diagnostic workflow consumes reagents, antibodies, kits, and probes, contributing to the recurring nature of oncology testing. Similarly, the rise in PCR, NGS, and multiplex testing is propelling kits & reagents, making them the fastest-growing major consumable category at 7.6% CAGR.
Furthermore, compared to pathology and imaging instruments in the instruments segment, molecular diagnostic instruments are experiencing faster growth, leading to expansion of precision oncology. While a smaller share contributes to the services segment, creating an important outsourcing opportunity, especially for genomic testing and digital pathology.
| Segment/Sub-segment | Market Share | CAGR |
| In Vitro Diagnostics | 31.00% | 6.10% |
| Immunoassays | 10.00% | 5.80% |
| Histopathology | 11.00% | 5.90% |
| Immunohistochemistry | 7.00% | 6.80% |
| Flow Cytometry & Cytology | 3.00% | 6.20% |
| Molecular Diagnostics | 30.00% | 8.10% |
| PCR | 11.00% | 7.40% |
| NGS | 8.00% | 9.20% |
| In Situ Hybridization | 4.00% | 6.80% |
| ctDNA / Cell-Free DNA | 3.00% | 10.10% |
| DNA Methylation & Microarrays | 2.00% | 7.00% |
| Other Molecular Technologies | 2.00% | 7.20% |
| Imaging Diagnostics | 25.00% | 5.90% |
| CT | 9.00% | 5.50% |
| MRI | 6.00% | 6.00% |
| PET | 5.00% | 6.80% |
| Mammography | 3.00% | 5.40% |
| Ultrasound | 2.00% | 5.60% |
| Biopsy-Based Diagnostics | 11.00% | 6.70% |
| Tissue Biopsy | 7.00% | 6.00% |
| Liquid Biopsy | 2.00% | 10.00% |
| Image-Guided Biopsy | 2.00% | 7.40% |
| Other Technologies | 3.00% | 6.30% |
The given table suggests that the in vitro diagnostics segment dominated the market with 31% in 2025, as IVD supported routine biomarker and pathology testing across cancer centers, higher diagnostic volumes sustained demand for laboratory-based assays, and automation improved throughput and standardization. The liquid biopsy subsegment held 2% market share in 2025 and is anticipated to expand rapidly at a 10% CAGR during the predicted period, as blood-based testing reduces dependence on invasive sampling, ctDNA enables repeated molecular monitoring, and precision-oncology programs accelerate clinical adoption.
Analyst View - Technology
The market encompasses a relatively balanced technology structure with 31% contributing to IVDs, 30% to molecular diagnostics, and 25% to imaging categories, which makes growth differential more important than the current share. The molecular diagnostics, NGS, and ctDNA/cell-free DNA growing at a CAGR of 8.1%, 9.2%, and 10.1%, respectively, reflects that the technology mix is gradually shifting toward diagnostics offering genomic and molecular information along with conventional pathology.
| Cancer Type | Market Share | CAGR |
| Breast Cancer | 22.00% | 7.00% |
| Lung Cancer | 16.00% | 7.40% |
| Colorectal Cancer | 13.00% | 6.80% |
| Prostate Cancer | 12.00% | 6.60% |
| Liver Cancer | 7.00% | 6.40% |
| Cervical Cancer | 6.00% | 6.10% |
| Blood Cancers | 11.00% | 8.00% |
| Leukemia | 5.00% | 7.70% |
| Lymphoma | 4.00% | 8.10% |
| Multiple Ieloma | 2.00% | 8.30% |
| Skin Cancer | 4.00% | 6.90% |
| Ovarian Cancer | 3.00% | 7.00% |
| Pancreatic Cancer | 2.00% | 7.50% |
| Other Cancers | 4.00% | 6.20% |
Based on our research, the data covers various types of cancers, their market share in 2025, and CAGR. The breast cancer segment held the major market share of 22% in 2025, due to high testing demand supported by imaging and biomarker diagnostics, screening and early-detection programs, which expanded diagnostic volumes, and growth in HER2 and hormone-receptor testing. The blood cancers segment held 11% market share in 2025 and is expected to show the fastest growth at 8% CAGR during the upcoming years, due to increasing demand for flow cytometry for detailed hematological diagnosis, growing use of molecular profiling to guide targeted treatment, and a shift towards specialized oncology centers for advanced hematology testing.
Analyst View - Cancer Type
The importance of screening, imaging, pathology, and HER2/hormone-receptor testing is increasing as the breast cancer segment held the major share of the market in 2025, while the expansion of the lung cancer segment at 16% market share contributes to the growing importance of CT/PET and molecular profiling. Whereas the highest growth is anticipated in the blood cancer segment, which is supported by flow cytometry, immunophenotyping, molecular profiling, and specialized hematology testing, making it the most relevant segment for advanced diagnostic laboratories.
| Clinical Positioning | Market Share | CAGR |
| Screening | 25.00% | 6.60% |
| Population-Based Screening | 13.00% | 6.40% |
| High-Risk Screening | 8.00% | 7.10% |
| Opportunistic Screening | 4.00% | 6.50% |
| Early Detection | 22.00% | 8.00% |
| Biomarker-Based Detection | 7.00% | 7.70% |
| Imaging-Based Detection | 7.00% | 6.90% |
| Molecular Detection | 5.00% | 8.50% |
| Liquid Biopsy-Based Detection | 3.00% | 11.00% |
| Diagnosis & Confirmation | 21.00% | 6.20% |
| Histological Diagnosis | 12.00% | 5.90% |
| Molecular Confirmation | 5.00% | 7.00% |
| Biomarker Confirmation | 4.00% | 6.80% |
| Therapy Selection | 16.00% | 7.80% |
| Companion Diagnostics | 5.00% | 9.00% |
| Genomic Profiling | 6.00% | 8.60% |
| Biomarker Testing | 5.00% | 7.00% |
| Treatment Response Assessment | 9.00% | 7.30% |
| Recurrence & Disease Monitoring | 7.00% | 7.60% |
As per the analysis, the screening segment registered dominance over the market with a 25% share in 2025, due to national cancer-control programs which increased screening activity, breast and cervical screening created recurring diagnostic demand, and increased awareness campaigns encouraged earlier participation in testing. The liquid biopsy-based detection subsegment held 3% market share in 2025 and is expected to show the highest growth at 11% CAGR during the forecast period, due to blood-based assays providing minimally invasive testing, ctDNA platforms supporting emerging early-detection applications, and biopharma partnerships accelerating clinical validation.
Analyst View - Clinical Positioning
The largest clinical position is held by the screening segment with a 25% market share, which demonstrated slow growth compared to early detection, growing at an 8.0% CAGR. The highest growth areas are molecular and liquid-biopsy applications, where the potential of minimally invasive molecular testing is highlighted by liquid-biopsy-based early detection expanding at an 11.0% CAGR, while their clinical validation, regulatory acceptance, reimbursement, and integration into screening pathways also remain important adoption considerations.
| End User | Market Share | CAGR |
| Hospitals & Cancer Centers | 57.00% | 6.60% |
| Public Hospitals | 28.00% | 6.30% |
| Private Hospitals | 17.00% | 7.00% |
| Specialized Cancer Centers | 8.00% | 8.20% |
| Academic Medical Centers | 4.00% | 7.40% |
| Diagnostic Laboratories | 25.00% | 7.70% |
| Hospital-Based Laboratories | 10.00% | 6.70% |
| Independent Laboratories | 7.00% | 7.50% |
| Reference Laboratories | 5.00% | 8.20% |
| Genomic Testing Laboratories | 3.00% | 9.50% |
| Research Institutes | 8.00% | 7.20% |
| Academic Research Institutes | 3.50% | 7.00% |
| Government Research Centers | 2.50% | 6.70% |
| Clinical Research Organizations | 2.00% | 8.40% |
| Pharmaceutical & Biotechnology Companies | 7.00% | 7.90% |
| Other End Users | 3.00% | 6.50% |
According to the survey conducted, the table focuses on various end users along with their market shares and CAGR. The hospitals & cancer centers segment led the market with a 57% share in 2025, due to high volumes of cancer diagnosis and staging, new oncology centers that expanded access to advanced diagnostics, and integrated care pathways, which encouraged in-house testing. The genomic testing laboratories subsegment held a 3% market share in 2025 and is expected to expand rapidly with a 9.5% CAGR during the forecast period, as precision oncology drives comprehensive genomic profiling, pharma partnerships expand biomarker testing volumes, and advanced sequencing infrastructure supports complex assays.
Analyst View - End User
The hospitals & cancer centers segment contributed to the principal demand base, with 57% market share in 2025, which was backed by high cancer-testing volumes, enhanced access to imaging and pathology infrastructure, and integrated oncology pathways. The rapid expansion of the diagnostic laboratories segment at 7.7% CAGR accounted for the fastest-growing major end-user group, where the genomic testing laboratories segment, growing at 9.5% CAGR, mirrors the increasing requirement for specialized infrastructure and expertise for NGS and advanced molecular testing.
|
TAM Dimension
|
Real Data/Intelligence
|
Market Interpretation
|
|
Total Oncology Diagnostics Opportunity
|
2025 Middle East oncology diagnostics market: USD 1.50 billion
|
Represents the supplied addressable market across pathology, imaging, molecular diagnostics, biopsy and diagnostic services.
|
|
Liquid Biopsy Opportunity
|
Towards Healthcare: Middle East liquid biopsy market USD 212.4 million in 2025, projected to USD 874.34 million by 2035, at 15.2% CAGR
|
Liquid biopsy represents a high-growth molecular opportunity within the broader oncology diagnostics ecosystem.
|
|
Cancer Diagnostic Demand Pool
|
Towards Healthcare identifies 28,000+ cancer cases in Saudi Arabia, 33,000+ in Israel, 4,800+ in UAE, 2,700+ in Oman and 1,800+ in Qatar in its Middle East liquid-biopsy analysis.
|
These markets provide substantial patient pools for cancer screening, diagnosis, biomarker testing and monitoring.
|
|
Precision Oncology TAM
|
MEA precision oncology market: USD 3.99 billion in 2025, projected to USD 9.02 billion by 2035, 8.50% CAGR
|
Diagnostics forms an important enabling layer within precision oncology, particularly genomic profiling and biomarker testing.
|
Based on the information gathered by our senior researcher, Aman Singh, the table encompasses TAM dimensions with real data and market interpretation. It highlights that the total oncology diagnostics opportunity is driven by pathology, imaging, and other diagnostic services, while liquid biopsy promotes high-growth molecular opportunities. Cancer diagnostic demand pool fuels cancer screening, testing, and monitoring, whereas precision oncology TAM expands genomic profiling and biomarker testing opportunities.
Analyst View - TAM
The broadest opportunity extends beyond conventional diagnostic testing into precision oncology infrastructure. One of the clearest high-growth niches is provided by liquid biopsy and offers a substantially faster growth trajectory than the overall oncology diagnostics market, as per the supplied Towards Healthcare benchmark.
| SAM Dimension | Real Data/Intelligence | Strategic Interpretation |
| Hospital & Cancer-Center Market | Hospitals and cancer centers represent 57% of the supplied oncology diagnostics market | Hospitals remain the largest serviceable institutional buyer pool. |
| Diagnostic-Laboratory Market | Diagnostic laboratories represent 25%, growing at 7.7% CAGR | Centralized and reference laboratories provide a growing platform for specialized testing. |
| Molecular Diagnostics | Molecular diagnostics represent 30%, growing at 8.1% CAGR | Molecular testing provides a major serviceable opportunity around PCR, NGS, and liquid biopsy. |
| Genomic Testing | Genomic testing laboratories grow at 9.5% CAGR in the supplied segmentation | Advanced genomic infrastructure creates a specialized SAM with higher testing complexity. |
| Liquid Biopsy | Middle East liquid biopsy benchmark: USD 212.4 million in 2025 | Represents a specialized SAM within molecular oncology diagnostics. |
| Precision Oncology Diagnostics | MEA precision oncology: USD 3.99 billion in 2025 | Biomarker, genomic and companion-diagnostic services benefit from the broader precision-oncology investment environment. |
The above-mentioned table represents that 57% of hospitals and cancer centers held the largest serviceable institutional buyer pool; diagnostic laboratories, with 25%, are expanding the platform for specialized testing, while molecular diagnostics, with 30%, drives major opportunities across PCR, NGS, and liquid biopsy. The rapid expansion of genomic testing laboratories with 9.5% CAGR offers advanced infrastructure; liquid biopsy holds a specialized position within molecular oncology diagnostics, whereas precision oncology diagnostics supports biomarker, genomic, and companion-diagnostic services.
Analyst View - SAM
The organizations with laboratory infrastructure, specialist personnel, validated testing workflows, and oncology referral volumes are the key areas for the serviceable market. It is confirmed that molecular/genomic testing is the most technically demanding portion of the SAM, suggesting that providers may invest in either local infrastructure or outsource complex testing to reference laboratories.
| SOM Dimension | Obtainable-Market Indicator | Commercial Relevance |
| Hospitals & Cancer Centers | 57% market share | Largest institutional customer pool |
| Diagnostic Laboratories | 25% market share | Strong outsourcing and centralized-testing opportunity |
| Specialized Cancer Centers | 8% share; 8.2% CAGR | High-value advanced diagnostics |
| Genomic Testing Laboratories | 3% share; 9.5% CAGR | Specialized NGS and molecular-testing opportunity |
| Pharmaceutical & Biotechnology Companies | 7% share; 7.9% CAGR | Companion diagnostics, clinical trials and biomarker development |
| Liquid Biopsy | USD 212.4M Middle East benchmark in 2025 | High-growth obtainable niche |
| NGS | 8% technology share; 9.2% CAGR | Comprehensive genomic profiling opportunity |
| ctDNA | 3% technology share; 10.1% CAGR | Emerging monitoring and recurrence opportunity |
As per our research, SOM should not be calculated as an arbitrary percentage of the USD 1.50 billion market for oncology diagnostics. Thus, the obtainable revenue is based on the addressable buyer network, installed infrastructure, reimbursement environment, and test volumes.
Analyst View - SOM
According to the above-mentioned data, the most realistic obtainable market is concentrated in high-volume hospitals, specialized cancer centers, reference laboratories, and genomic-testing laboratories. The number of qualified accounts, contracted testing volumes, the breadth of the diagnostic menu, installed instruments, reimbursement/access, and physician referrals are the primary factors for the determination of SOM for vendors.
| Consumer Behavior Factor | Available Intelligence | Implication |
| Minimally Invasive Testing | Blood samples represented 88% of Middle East liquid-biopsy demand in the supplied Towards Healthcare benchmark | Convenience and lower invasiveness support blood-based molecular testing. |
| Precision Medicine | Increasing adoption of personalized medicine and biomarker-guided oncology is identified as a growth factor | Patients increasingly encounter diagnostics directly linked to treatment decisions. |
| Early Detection | Cancer-screening initiatives and greater awareness support early diagnosis | Screening, biomarkers and imaging gain importance before advanced disease presentation. |
| Repeat Testing | ctDNA and molecular monitoring support repeated assessments | Diagnostics increasingly extend beyond initial diagnosis into treatment monitoring and recurrence surveillance. |
| Convenience | Minimally invasive sample collection reduces procedural burden | Simple collection models can improve acceptance of repeat molecular testing. |
| Specialist-Led Testing | Advanced cancer diagnostics remain concentrated around hospitals, cancer centers and laboratories | Clinical confidence and specialist availability remain important to test adoption. |
As per our senior research analyst, Payal Rabde, the table covers factors influencing consumer behavior, along with their implication on the market. Minimally invasive testing contributes to the highest consumer preference due to its convenience and lower invasiveness. On the other hand, early detection is expanding rapidly due to growing cancer screening initiatives.
Analyst View - Consumer Behavior
Patient behavior is driven by diagnostics that offer earlier information, greater personalization, and lower procedural burden, where these preferences align particularly with blood-based liquid biopsy. Nevertheless, physician recommendation, reimbursement, clinical validation, and affordability are also essential for determining their adoption rather than consumer acceptance alone.
| Buyer Group | Purchasing Priorities | Available Market Intelligence |
| Hospitals & Cancer Centers | Accuracy, turnaround time, test menu, workflow integration, equipment reliability, clinical utility | Hospitals & cancer centers account for 57% of the supplied market. |
| Diagnostic Laboratories | Throughput, cost/test, automation, reagent availability, platform compatibility and specialist support | Diagnostic laboratories account for 25% and grow at 7.7%. |
| Specialized Cancer Centers | NGS, biomarkers, companion diagnostics, digital pathology, advanced imaging | Specialized cancer centers grow at 8.2%. |
| Genomic Testing Laboratories | Sequencing capacity, bioinformatics, assay validation, interpretation and data infrastructure | Genomic testing laboratories grow at 9.5%. |
| Pharma & Biotech | Biomarker identification, patient stratification, companion diagnostics and clinical-trial testing | Pharma/biotech represents 7% and grows at 7.9%. |
| Research Institutes | Research-grade platforms, sequencing, molecular assays and flexible workflows | Research institutes account for 8%. |
Based on the information gathered, a wide range of technology selection criteria such as clinical accuracy and validation, turnaround time, cost per test, test-menu breadth, instrument throughput, reagent availability, laboratory automation, compatibility with existing infrastructure, specialist availability, data interpretation and bioinformatics, regulatory/accreditation requirements, reimbursement and economic value, vendor technical support, and scalability for future genomic testing are responsible for boosting purchasing priorities among the buyer groups.
Analyst View - Buyer Intelligence
Complete diagnostic workflows are being increasingly purchased by institutional buyers instead of standalone instruments. Moreover, considering a molecular-testing platform, requiring instruments, assay validation, reagents, interpretation, technical support, and bioinformatics, creates opportunities for vendors providing integrated solutions as well as for reference laboratories offering advanced testing, eliminating the need for every hospital to build its own NGS or liquid-biopsy infrastructure.
| Opportunity | Supporting Market Data |
| Molecular Diagnostics | 30% share; 8.1% CAGR |
| NGS | 8% share; 9.2% CAGR |
| ctDNA/Cell-Free DNA | 3% share; 10.1% CAGR |
| Liquid Biopsy | 2% share; 10.0% CAGR |
| Liquid-Biopsy-Based Early Detection | 3% share; 11.0% CAGR |
| Companion Diagnostics | 5% share; 9.0% CAGR |
| Genomic Testing Laboratories | 3% share; 9.5% CAGR |
| Genomic Testing Services | 2.5% share; 8.2% CAGR |
| Diagnostic Laboratories | 25% share; 7.7% CAGR |
| Specialized Cancer Centers | 8% share; 8.2% CAGR |
| Blood Cancers | 11% share; 8.0% CAGR |
| Early Detection | 22% share; 8.0% CAGR |
According to our research, the table highlights various market opportunities along with their market shares and CAGR. Therefore, the expansion of diagnostics, laboratories, services, specialized centres, and various cancer types is creating new openings for innovations, collaborations, and investments, which is anticipated to fuel market growth.
| Company | Core Oncology Diagnostics Exposure | Relevant Technologies/Products | Middle East Relevance | Key Strategic Focus |
| Roche Diagnostics | Very broad | IHC, ISH, pathology, molecular diagnostics, companion diagnostics, digital pathology, genomic profiling | Regional diagnostics organization with Middle East operations | Integrated pathology + molecular + digital oncology workflow |
| Danaher | Broad through multiple diagnostic businesses | Anatomic pathology, molecular diagnostics, PCR, sequencing, laboratory automation | Major multinational diagnostics platform | Integrated laboratory and molecular workflows |
| Siemens Healthineers | Strong imaging + diagnostics | CT, MRI, PET/CT, molecular diagnostics, laboratory diagnostics | Strong hospital and imaging exposure | Advanced imaging, automation and oncology workflow integration |
| Abbott | IVD and molecular diagnostics | Immunoassays, molecular testing, laboratory systems | Established Middle East IVD presence | High-throughput laboratory and molecular testing |
| Thermo Fisher Scientific | Strong precision oncology exposure | NGS, molecular diagnostics, oncology assays, sequencing | Important for advanced genomic testing | NGS, precision oncology and localized genomic testing |
| QIAGEN | Molecular oncology specialist | PCR, NGS, sample preparation, companion diagnostics, liquid-biopsy-related workflows | Relevant to molecular and genomic laboratories | Molecular testing and precision medicine |
| Illumina | Genomics specialist | NGS platforms, sequencing, oncology genomic profiling | Important for cancer genomics infrastructure | Comprehensive genomic profiling and sequencing |
| Agilent Technologies | Molecular/pathology | IHC, ISH, pathology, genomics and molecular analysis | Relevant to pathology and molecular laboratories | Biomarker testing and molecular pathology |
| BD | Oncology laboratory/cellular diagnostics | Flow cytometry, cell analysis, molecular and laboratory systems | Relevant to hematological malignancies and research | Cellular characterization and laboratory automation |
| Hologic | Breast/cervical diagnostics | Mammography, breast imaging, molecular diagnostics, cervical cancer testing | Relevant to breast and cervical cancer screening | Women's cancer screening and diagnostic technologies |
| Bio-Rad Laboratories | Laboratory/molecular diagnostics | PCR, digital PCR, quality controls, molecular testing | Relevant to molecular laboratories | Molecular testing and laboratory QC |
| Sysmex | Hematology/oncology diagnostics | Hematology analyzers, flow/cell analysis and laboratory systems | Relevant to blood cancers | Hematological diagnostics and automation |
| GE HealthCare | Imaging diagnostics | CT, MRI, PET/CT, molecular imaging, ultrasound | Major imaging infrastructure supplier | Oncology imaging and AI-enabled imaging |
| Philips Healthcare | Imaging | CT, MRI, PET/CT, ultrasound and image-guided solutions | Hospital and cancer-center imaging | Imaging workflow and precision-guided diagnosis |
| Fujifilm | Imaging + pathology | Endoscopy, imaging, digital pathology and diagnostic systems | Relevant to oncology imaging and pathology | Digitalization and advanced imaging |
| Myriad Genetics | Molecular/precision oncology | Hereditary cancer testing and molecular diagnostics | Relevant to precision oncology | Genomic risk assessment and personalized medicine |
| Exact Sciences | Molecular cancer diagnostics | Screening and molecular cancer testing | Emerging precision-diagnostics relevance | Early detection and molecular screening |
As per the analysis, different types of companies, their oncology diagnostic exposures, products, Middle East significance, and strategic goals are covered in this table. Roche, Thermo Fisher, Siemens Healthineers, and Danaher are the major market players, while Abbott, QIAGEN, Illumina, Agilent, BD, Hologic, Bio-Rad, Sysmex, GE HealthCare, Philips, Fujifilm, and others are relevant participants across Middle East cancer diagnostics, molecular diagnostics, biopsy, and imaging.
Analyst View:
Rather than competing in only one diagnostic modality, the ability of connecting pathology, biomarker testing, molecular diagnostics, and treatment-selection workflows contributes to Roche's strategic relevance.
Analyst View:
Thermo Fisher accounts for the market's 9.2% NGS CAGR and broader 8.1% molecular diagnostics growth opportunity across the market.
Analyst View:
In oncology diagnostics, Siemens is positioned across the infrastructure-heavy portion, supporting cancer centers that require high-end imaging for localization, staging, and treatment monitoring.
Danaher's standing in the market is driven by its portfolio of diagnostic businesses and technologies, including molecular diagnostics, PCR, anatomic pathology, laboratory automation, cell analysis, and diagnostic workflow systems.
Additionally, based on the information gathered, the company is recognized as one of the major participants in both the global cancer-diagnostics market and the Middle East/MEA IVD landscape.
Analyst View:
The market's movement toward integrated laboratory workflows is the most relevant to Danaher's broad platform exposure instead of individual diagnostic instruments.
| Company | Pathology/IHC | Molecular/PCR | NGS | Liquid Biopsy/Genomics | Imaging | Digital/AI |
| Roche | ● | ● | ● | ● | - | ● |
| Danaher | ● | ● | ● | ● | - | ● |
| Siemens Healthineers | - | ● | - | - | ● | ● |
| Abbott | ● | ● | - | ● | - | ● |
| Thermo Fisher | - | ● | ● | ● | - | ● |
| QIAGEN | - | ● | ● | ● | - | ● |
| Illumina | - | - | ● | ● | - | ● |
| Agilent | ● | ● | ● | ● | - | ● |
| BD | - | ● | - | - | - | ● |
| Hologic | ● | ● | - | ● | ● | ● |
| Bio-Rad | - | ● | ● | ● | - | ● |
| Sysmex | - | ● | - | - | - | ● |
| GE HealthCare | - | - | - | - | ● | ● |
| Philips | - | - | - | - | ● | ● |
| Fujifilm | ● | ● | - | - | ● | ● |
Based on the survey conducted by our senior researcher, Aman Singh, the table illustrates relevant portfolio exposure, which is a qualitative technology-mapping indicator, not market share. It indicates that all the companies are actively focusing on digital or AI capabilities, while most of the companies are also strengthening their molecular/PCR, NGS, and genomics capabilities.
| Company Data Point | Why It Matters |
| Global diagnostics revenue | Establishes company scale |
| Diagnostics segment revenue | Separates diagnostics from total corporate revenue |
| Oncology-related revenue, where disclosed | More directly relevant to the market |
| Middle East presence | Measures regional commercial footprint |
| Regional headquarters/offices | Indicates local operating infrastructure |
| Distributor/partner network | Important for market access |
| Installed systems | Indicates platform penetration |
| Oncology product portfolio | Identifies competitive exposure |
| NGS portfolio | Measures precision-oncology positioning |
| PCR portfolio | Measures molecular-testing exposure |
| Liquid-biopsy portfolio | Captures emerging diagnostic exposure |
| IHC/pathology portfolio | Captures conventional oncology diagnostics |
| Imaging portfolio | Captures CT/MRI/PET exposure |
| Companion diagnostics | Links diagnostics to targeted therapies |
| Recent launches | Identifies innovation direction |
| Partnerships | Identifies regional expansion |
| Clinical-trial collaborations | Measures pharma/biotech relationships |
| Manufacturing/regional facilities | Indicates supply-chain presence |
| Regulatory approvals | Measures commercialization readiness |
| Strategic investments | Indicates commitment to the segment |
As per the information gathered, various factors are responsible for maintaining the company's position in the market. The table highlights that growth of oncology diagnostic revenue, distribution networks, installed systems, oncology product portfolio, collaborations, Middle East facilities, and strategic investments are important factors for the company to contribute to the significant market expansion.
By Product
By Technology
By Cancer Type
By Clinical Positioning
By End User
Our senior researcher, Aditi Shivarkar, conducted a detailed research, analysing company data, clinical trends, and industry developments. Based on her comprehensive analysis, the following strategic key takeaways highlight the most important market insights and opportunities.
For Service Providers & CDMOs
For Pharma & Biotech Companies
For Investors & Corporate Strategy Teams
Based on the assessment, the market is expanding rapidly due to increasing incidences of cancer across the Middle East. The growth in health awareness and government initiatives are also promoting their early detection. The new collaborations among the major companies can accelerate the development of new diagnostic products and enhance access to their services. Strong growth in molecular diagnostics and genomics are also expected to create new market opportunities.
Payal Rabde, Senior Research Analyst, led the primary market research, developed the methodology, analysed trends, segmentation, competition, forecasts, and strategic opportunities, forming the report's analytical foundation.
Aman Singh, senior researcher, was responsible for collecting and validating clinical trial data, research publications, company information, partnerships, and other quantitative datasets, strengthening evidence-based analysis and market estimations.
Aditi Shivarkar, senior researcher, reviewed the complete research document, performed quality checks, validated findings, refined content, corrected inconsistencies, and finalized the report, ensuring accuracy, clarity, credibility, and publication-ready quality.


Principal Consultant
Payal Rabde is a Healthcare Market Research Analyst at Towards Healthcare Research & Consulting with 4+ years of experience in pharmaceuticals, biotechnology, medical devices, and life sciences.
Learn more about Payal Rabde

Reviewed By
Aditi Shivarkar is a seasoned professional with over 14 years of experience in healthcare market research. As a content reviewer, Aditi ensures the quality and accuracy of all market insights and data presented by the research team.
Learn more about Aditi Shivarkar