

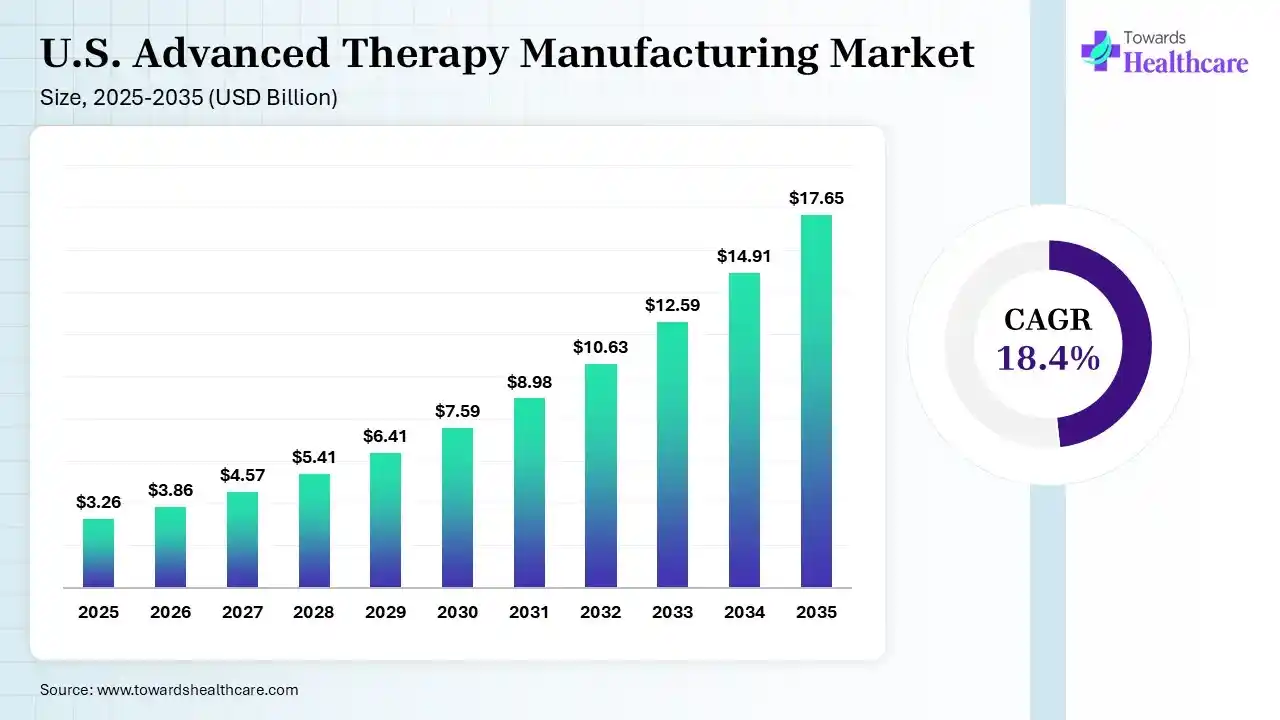
Research indicates strong growth opportunities in the U.S. advanced therapy manufacturing market. The U.S. advanced therapy manufacturing market size was estimated at USD 3.26 billion in 2025 and is predicted to increase from USD 3.86 billion in 2026 to approximately USD 17.65 billion by 2035, expanding at a CAGR of 18.4% from 2026 to 2035. Analysis also highlights that the U.S. advanced therapy manufacturing market is rapidly expanding due to increasing allogeneic cell therapies, expanding manufacturing services, growing FAD approvals, increasing cancer therapies, advancements in rare genetic disorder therapies, growing outsourcing trends, and increasing technological advancements.
The U.S. advanced therapy manufacturing refers to the production of medications with the use of tissue, cells, and genes for the treatment of various diseases and injuries across the U.S. The different types of advanced therapies include cell therapies, gene therapies, tissue-engineered products, combined advanced therapy medicinal products (ATMPs), etc. The manufacturing services offered during their production include clinical manufacturing, GMP manufacturing, fill-finish services, process development, analytical testing, regulatory support, and storage & logistics.
Moreover, the market was valued at US$3.26 billion in 2025 and is expected to expand at 18.4% CAGR during the predicted time. Additionally, the report covers therapy type/products, services, development phases, therapeutic areas, end user, manufacturing modes, manufacturing workflows, and manufacturing scales along with the TAM-SAM-SOM, buyer intelligence, consumer behaviour, technology preference, and future opportunities.
Cell Therapy Segment Dominates the Market with 44.20% share in 2025
| Segmentation | 2025 Share | 2025 Market Value* | CAGR |
| Cell Therapy | 44.20% | US$1.44 B | 18.80% |
| Autologous Cell Therapy | 27.50% | US$0.90 B | 17.90% |
| Allogeneic Cell Therapy | 12.90% | US$0.42 B | 22.60% |
| Other Cell-Based Therapies | 3.80% | US$0.12 B | 19.10% |
| Gene Therapy | 42.10% | US$1.37 B | 20.40% |
| In Vivo Gene Therapy | 25.10% | US$0.82 B | 19.80% |
| Ex Vivo Gene Therapy | 11.20% | US$0.37 B | 21.70% |
| Gene-Modified Cell Therapy | 5.80% | US$0.19 B | 22.10% |
| Tissue-Engineered Products | 10.20% | US$0.33 B | 15.90% |
| Skin/Substitute | 3.40% | US$0.11 B | 15.10% |
| Cartilage/Bone | 2.80% | US$0.09 B | 16.20% |
| Vascular Tissue | 2.10% | US$0.07 B | 18.40% |
| Organ/Tissue Regeneration | 1.90% | US$0.06 B | 17.80% |
| Other Advanced Therapies | 3.50% | US$0.11 B | 17.20% |
Based on our research, the table highlights different types of therapy or products, market share, and CAGR. The cell therapy segment held the dominant share of 44.20% in 2025 due to the expansion of CAR-T commercialization, allogeneic platforms, and clinical pipelines. The allogeneic cell therapy subsegment is expected to expand rapidly with a 22.60% CAGR during the forecast period, due to increasing off-the-shelf therapies, investment in scalable donor-derived cell platforms, and increasing automation and cryopreservation services.
Analyst View
The advanced cell processing, viral-vector production, gene modification, analytical characterization, and GMP manufacturing are considered the core addressable capability areas, as cell therapy and gene therapy together account for 86.3%, while 22.6% CAGR for allogeneic cell therapy and 22.1% for gene-modified cell therapy highlights the requirement for strong manufacturing-capability expansion.
Manufacturing Services Segment Leads the Market with 48.60%
| Service Type | Share | Approx. 2025 Value | CAGR |
| Manufacturing Services | 48.60% | US$1.58 B | 18.90% |
| Clinical Manufacturing | 25.80% | US$0.84 B | 18.10% |
| Commercial Manufacturing | 13.70% | US$0.45 B | 22.30% |
| GMP Manufacturing | 5.80% | US$0.19 B | 19.20% |
| Fill-Finish | 3.30% | US$0.11 B | 18.50% |
| Process Development Services | 20.40% | US$0.67 B | 18.70% |
| Process Design | 6.10% | US$0.20 B | 17.80% |
| Process Optimization | 5.70% | US$0.19 B | 19.10% |
| Scale-Up & Technology Transfer | 5.30% | US$0.17 B | 20.50% |
| Manufacturing Process Validation | 3.30% | US$0.11 B | 18.60% |
| Analytical Testing & QC | 16.20% | US$0.53 B | 21.40% |
| Regulatory & Compliance Support | 8.40% | US$0.27 B | 19.70% |
| Storage & Logistics | 6.40% | US$0.21 B | 18.20% |
The given table illustrates that the manufacturing services segment held the largest share of 48.60% of the market in 2025 due to growth in outsourced specialized GMP production, commercialization of cell and gene therapies, and specialized facilities. The commercial manufacturing subsegment held 13.70% in 2025 and is anticipated to show the highest growth of 22.3% CAGR during the predicted period, due to increasing FDA approvals of validated commercial capacity, growing demand for more consistent production, and rising long-term supply agreements.
Analyst View:
As advanced therapies progress through clinical development and commercialization, the demand for identity, purity, potency, safety, genomic characterization, and release testing increases, which is represented by manufacturing services contributing to nearly half of the market and analytical testing & QC growing at 21.4%.
Phase I Segment Held a Dominant Share of 42% of the Market
| Development Phase | Share | Approx. 2025 Value | CAGR |
| Preclinical | 14.00% | US$0.46 B | 22.80% |
| Phase I | 42.00% | US$1.37 B | 18.00% |
| Phase II | 25.00% | US$0.82 B | 18.60% |
| Phase III | 14.00% | US$0.46 B | 22.90% |
| Phase IV/Commercial | 5.00% | US$0.16 B | 21.70% |
As per the analysis, the table highlights different development phases along with their market share and CAGR. The Phase I segment held the major share of 42% in 2025, as large numbers of emerging programs required first-in-human GMP batches and small biotech companies frequently outsourced early clinical manufacturing. The Phase III segment is predicted to show the fastest growth with 22.90% CAGR during the upcoming years, as pivotal studies require substantially larger manufacturing volumes and late-stage programs increasingly reserve dedicated manufacturing capacity.
Analyst View:
The large share of the Phase I segment represents early clinical program generates substantial manufacturing demand, while the Phase III segment is growing at 22.9%, which promotes the demand for validated scale-up, process consistency, commercial readiness, technology transfer, and larger GMP capacity.
Oncology Segment Contributed to 43% of Market Share
| Therapeutic Area | Share | Approx. 2025 Value | CAGR |
| Oncology | 43.00% | US$1.40 B | 18.90% |
| Hematology | 12.00% | US$0.39 B | 19.40% |
| Rare Genetic Disorders | 11.00% | US$0.36 B | 23.20% |
| CNS | 7.00% | US$0.23 B | 21.00% |
| Musculoskeletal | 5.00% | US$0.16 B | 17.40% |
| Cardiology | 5.00% | US$0.16 B | 20.70% |
| Dermatology | 4.00% | US$0.13 B | 16.50% |
| Ophthalmology | 3.00% | US$0.10 B | 19.80% |
| Endocrine & Metabolic | 3.00% | US$0.10 B | 21.20% |
| Immunology & Inflammation | 2.50% | US$0.08 B | 19.60% |
| Infectious Diseases | 2.00% | US$0.07 B | 17.20% |
| Gastroenterology | 1.50% | US$0.05 B | 16.80% |
| Other | 1.00% | US$0.03 B | 15.70% |
The above-mentioned table confirms that the oncology segment led the market with a 43% share in 2025 due to the rise in CAR-T, engineered-cell therapies, and large clinical pipelines. The rare genetic disorders segment held 11% market share in 2025 and is expected to expand rapidly with 23.2% CAGR during the forecast period, as advancing high-value gene therapies, increasing AAV and gene-modified cell platforms, and growing FDA approvals.
Analyst View:
The largest manufacturing demand pool is held by oncology due to the concentration of cell-based therapies, while rare genetic disorders are the fastest-growing therapeutic area driven by rising demand for vector manufacturing, gene-modification technologies, specialized analytical testing, and small-batch GMP production.
Biopharmaceutical Companies Segment Held Major Revenue Share of 57.50%
| End User | Share | Approx. 2025 Value | CAGR |
| Biopharmaceutical Companies | 57.50% | US$1.87 B | 18.90% |
| Large Pharma | 22.50% | US$0.73 B | 16.70% |
| Mid-Sized Biopharma | 15.00% | US$0.49 B | 19.40% |
| Emerging Biotech | 20.00% | US$0.65 B | 23.50% |
| Academic & Research Institutes | 18.00% | US$0.59 B | 16.90% |
| Universities | 7.00% | US$0.23 B | 16.20% |
| Academic Medical Centers | 8.00% | US$0.26 B | 17.50% |
| Government Research Institutions | 3.00% | US$0.10 B | 15.60% |
| Hospitals & Specialized Treatment Centers | 17.00% | US$0.55 B | 21.10% |
| Research Foundations & Non-Profits | 7.50% | US$0.24 B | 17.80% |
Based on the information gathered, the table covers various end users, market share, and CAGR. The biopharmaceutical companies segment registered dominance over the market with a 57.50% share in 2025 due to their largest advanced therapy pipeline and growth in outsourcing trends. The emerging biotechnology companies subsegment is expected to show the highest growth with a CAGR of 23.50% during the upcoming years, as external manufacturing accelerates clinical development timelines and flexible CDMO models reduce upfront capital requirements.
Analyst View:
The majority of demand is driven by biopharmaceutical companies, and emerging biotech shows the fastest growth, which strengthens the opportunity for outsourced manufacturing, process development, analytical testing, and flexible GMP capacity.
Contract Manufacturing Segment Led the Market with 65.70%
| Manufacturing Mode | Share | Approx. 2025 Value | CAGR |
| Contract Manufacturing | 65.70% | US$2.14 B | 18.70% |
| Full-Service CDMO | 31.50% | US$1.03 B | 19.30% |
| Specialized Manufacturing CDMO | 20.20% | US$0.66 B | 21.70% |
| Integrated Development & Manufacturing | 14.00% | US$0.46 B | 20.40% |
| In-House | 24.80% | US$0.81 B | 20.20% |
| Dedicated Facilities | 15.00% | US$0.49 B | 19.60% |
| Multi-Product | 9.80% | US$0.32 B | 21.10% |
| Hybrid | 9.50% | US$0.31 B | 22.40% |
As per the survey conducted, the table suggests that the contract manufacturing segment held the dominant share of 65.70% in 2025 due to established GMP infrastructure, technical expertise, and access to flexible capacity. The specialized manufacturing CDMO segment held 20.20% market share in 2025 and is anticipated to grow at the fastest CAGR of 21.7% during the predicted period, as complex modalities require highly specialized production expertise, and viral-vector and cell-processing specialists address capacity bottlenecks.
Analyst View:
Contract manufacturing registered dominance, while specialized CDMOs and hybrid models are expanding rapidly because developers can retain strategic process capabilities while accessing external manufacturing capacity, modality expertise, and GMP infrastructure.
TAM represents the maximum manufacturing and manufacturing-support opportunity generated by advanced therapies in the U.S.
| TAM Indicator | Real Data / Market Evidence | Strategic Interpretation |
| U.S. Advanced Therapy Manufacturing Market, 2025 | US$3.26B | Primary market-size anchor supplied for this report |
| 2025–2035 CAGR | 18.40% | Indicates rapid expansion of manufacturing demand |
| U.S. Cell & Gene Therapy CDMO Market, 2025 | US$3.14B | Closely related outsourced manufacturing benchmark |
| U.S. Cell & Gene Therapy CDMO Market, 2035 | US$37.5B | Demonstrates the potential expansion of the outsourced manufacturing ecosystem |
| U.S. CGT CDMO CAGR, 2026–2035 | 28.15% | Outsourced manufacturing is growing faster than the broader advanced-therapy manufacturing market |
| U.S. Cell & Gene Therapy Market, 2025 | US$4.09B | Downstream therapy market supporting manufacturing demand |
| U.S. Cell Therapy share | 66.20% | Largest therapy pool in the related U.S. CGT market |
| U.S. Gene Therapy share | 33.80% | Significant and rapidly developing manufacturing pool |
| In-house manufacturing | 46.70% | Large portion of manufacturing activity remains internal |
| CDMO manufacturing | 37.50% | Large outsourced opportunity |
| Hybrid manufacturing | 16.00% | Additional addressable outsourcing opportunity |
TAM analysis interprets that the advanced therapy manufacturing market should not be treated as equivalent to the U.S. therapy market, where TAM divides the value chain as;
Therapy R&D → Process Development → Clinical Manufacturing → Commercial Manufacturing → Analytical Testing → Fill-Finish → Storage → Logistics
Therefore, manufacturing-related expenditure can be generated by a developer at multiple points during the lifecycle of a therapy.
Analyst View - TAM
More advanced therapies entering clinical and commercial development and greater manufacturing intensity per therapy are two simultaneous expansion mechanisms supported by the U.S. TAM, which promotes pipeline growth and manufacturing demand even before products generate substantial commercial revenue.
1. Cell Therapy:
Cell therapy accounted for 66.2% of the broader U.S. CGT market in 2025 in the U.S. cell and gene therapy market which is further divided into manufacturing-implication and autologous therapies, creating manufacturing demand. Moreover, allogeneic cell therapy, the fastest-growing cell-therapy subsegment, offers different commercial opportunity due to off-the-shelf batches, potentially improving manufacturing utilization and reducing dependence on individualized production cycles.
2. Gene Therapy TAM
Gene therapy held 42.1% of the market and was considered the faster-growing therapy type in the related U.S. CGT market, while viral vectors represented 72% of the U.S. cell and gene therapy market's vector-type segmentation in 2025.
The manufacturing TAM generated by gene therapy includes;
Analyst View - Gene Therapy TAM
Vector productivity and analytical capability are driving the gene-therapy manufacturing opportunity. As programs move from clinical development toward commercialization, manufacturers are required to shift towards reproducible, scalable processes with validated analytical methods.
The manufacturing demand generated by a therapy typically progresses as:
Preclinical → IND-enabling production → Phase I → Phase II → Phase III → Commercial manufacturing
This creates opportunities across each transition, which makes pipeline activity one of the strongest leading indicators for manufacturing demand.
Analyst View - Pipeline TAM
Advanced therapy developers require GMP material in clinical development, which makes Phase I the largest share, while late-stage programs require larger, more reproducible, and increasingly commercial-ready manufacturing systems, making Phase III commercially important.
SAM reflects the portion of TAM which services through commercially available U.S. manufacturing infrastructure, CDMOs, specialized analytical providers, process-development providers, logistics companies, and related advanced-therapy service providers.
SAM Structure
| SAM Segment | Your Share | CAGR | Addressable Opportunity |
| Manufacturing Services | 48.60% | 18.90% | Clinical, commercial, GMP and fill-finish |
| Process Development | 20.40% | 18.70% | Process design, optimization, scale-up, validation |
| Analytical Testing & QC | 16.20% | 21.40% | Identity, purity, potency, safety and genomic testing |
| Regulatory & Compliance | 8.40% | 19.70% | CMC, IND/BLA, GMP and regulatory services |
| Storage & Logistics | 6.40% | 18.20% | Cryogenic storage, cold-chain and identity management |
The given table highlights SAM segments, their shares, CAGR, and opportunities. It indicates that manufacturing services therefore represent almost half of your addressable market.
| Manufacturing Model | 2025 Share |
| In-House | 46.70% |
| CDMO | 37.50% |
| Hybrid | 16.00% |
As large pharma maintains internal facilities, biotechs use dedicated facilities, and companies outsource only selected workflow stages, CDMO is not the entire manufacturing opportunity. Thus, vector production can be outsourced, but cell processing can be retained internally, or commercial manufacturing can be outsourced, and process development can be retained.
Analyst View - Outsourced SAM
The most commercially addressable SAM is increasingly modular, where individual workflow requirements can be captured by CDMOs without owning the entire therapy manufacturing relationship.
The clinical manufacturing segment held 25.8%, which was driven by increasingly transition from early research into human studies and require specialized GMP production. Its demand was generated by Phase I trials, Phase II expansion, Phase III pivotal studies, IND-enabling manufacturing, clinical comparability studies, and process optimization.
Key buyer requirements include
Clinical-stage customers generally prioritize:
Speed + GMP readiness + flexibility + technical expertise + regulatory documentation.
Commercial-stage customers increasingly prioritize:
Capacity + validated processes + reliability + scalability + long-term supply.
The commercial manufacturing segment held 13.7% and is anticipated to show faster growth with 22.3% CAGR due to validated commercial processes, larger manufacturing batches, redundant capacity, etc where approximately 50 FDA-approved cell and gene therapies over the prior decade are expanding the commercial product base.
The analytical testing & QC segment, which is one of the most technically important SAM categories, captured a 16.2% share in 2025. Its required capabilities include identity testing, purity testing, potency, sterility, genomic characterization, stability, etc.
Analyst View - Analytical SAM
Analytical testing is driving service opportunity and capacity bottleneck. Batch release and clinical supply can be delayed if manufacturing services expand without corresponding analytical capacity, which ultimately creates strong opportunity for specialized analytical CDMOs and testing laboratories.
SOM represents a portion of the SAM that individual companies can realistically capture. SAM should be determined by:
| SOM Dimension | What Determines Obtainable Revenue |
| Capacity | Available GMP suites, bioreactors, and production slots |
| Modality | CAR-T, AAV, lentiviral, TIL, gene editing, etc. |
| Development phase | Preclinical through commercial |
| Regulatory capability | GMP, CMC and regulatory readiness |
| Technology | Closed systems, automation, single-use systems |
| Analytical capability | In-house vs outsourced testing |
| Customer base | Emerging biotech vs large pharma |
| Facility geography | Proximity to biotech clusters and treatment centers |
| Scale | Clinical vs commercial manufacturing |
| Logistics | Cryogenic and chain-of-identity infrastructure |
Analyst View - SOM
The U.S. SOM is highly company-specific. It highlights that a CDMO with AAV expertise is unable to capture CAR-T demand automatically, whereas viral-vector manufacturing cannot be captured by CAR-T specialists. Thus, the actual obtainable market can be determined by modality-specific capacity, regulatory qualification, and production availability.
| Modality-Specific SOM | Demand Requires |
| CAR-T | Leukapheresis Coordination |
| Cell Isolation | |
| Activation | |
| Genetic Modification | |
| Expansion | |
| Formulation | |
| Cryopreservation | |
| Release Testing | |
| Chain-of-Identity | |
| Controlled Transportation | |
| AAV | Plasmid/Raw-Material Supply |
| Upstream Production | |
| Vector Harvesting | |
| Purification | |
| Concentration | |
| Formulation | |
| Potency Testing | |
| Empty/Full Capsid Characterization | |
| Lentiviral | Ex Vivo Gene Modification |
| CAR-T | |
| Hematopoietic Stem-Cell Programs | |
| Gene-Modified Cell Therapies |
Based on the information gathered by Towards Healthcare, the LV-based CGT research reports that North America held 48.9% of the global LV-based CGT products market in 2025 and recognizes ex vivo LV-modified cell therapies as the largest product segment with 38.6% market share.
It is concentrated around biotechnology, pharmaceutical, and clinical-research clusters focusing on autologous therapies, which are located across Massachusetts, California, North Carolina, New York, New Jersey, Pennsylvania, Maryland, and Texas.
The therapy developer/manufacturing customer is the primary “consumer”, where the real demand chain includes;
Biotech/Pharma → Manufacturing Partner → Clinical Site/Treatment Center → Patient
Thus, technical and commercial requirements drive manufacturing purchasing behavior.
|
Behavior
|
Market Evidence
|
Manufacturing Implication
|
|
Outsourcing
|
CDMO represents 37.5% of U.S. CGT manufacturing mix
|
Significant external manufacturing demand
|
|
In-house manufacturing
|
46.70%
|
Companies still retain strategic capabilities internally
|
|
Hybrid manufacturing
|
16%
|
Outsourcing often occurs selectively
|
|
Cell therapy demand
|
66.2% of U.S. CGT market
|
Strong demand for cell-processing infrastructure
|
|
Gene therapy
|
33.80%
|
Significant vector-manufacturing opportunity
|
|
Oncology
|
39.5% of U.S. CGT market
|
Major manufacturing demand center
|
|
Viral vectors
|
72% of vector-type segmentation
|
Strong vector-production requirement
|
The major purchasing decision is driven by three categories: build, buy, and hybrid.
Companies choose internal manufacturing when they prioritize:
Companies outsource when they prioritize:
Companies retain critical processes internally while outsourcing:
Commercial overflow capacity
Based on the U.S. CGT data, 46.7% in-house, 37.5% CDMO, and 16% hybrid are recognized as a three-part manufacturing structure.
Analyst View - Outsourcing Behavior
The 16% hybrid segment demonstrates that outsourcing does not necessarily require a complete transfer of manufacturing responsibility, which makes it commercially important, while modular outsourcing is an important customer behavior for companies outsourcing capacity-constrained activities and protecting proprietary processes.
The ability to support closed-system processing, automation, single-use technologies, and cryogenic systems is considered while evaluating manufacturing partners by consumers. To improve process optimization, quality control, and manufacturing efficiency, emerging technologies like AI, automation, and digital integration are being incorporated into advanced-therapy manufacturing.
Analyst View - Technology Behavior
The commercial importance of automation and closed-system platforms is increasing as technology purchasing is shifting from simply asking “Does the CDMO have capacity?” to “Can the CDMO provide reproducible, scalable, and transferable manufacturing?”
| Buyer Group | Role in Manufacturing Demand | Main Requirement |
| Emerging biotech | Clinical development | Flexible GMP manufacturing |
| Mid-sized biotech | Clinical + commercialization | Scale-up and technology transfer |
| Large pharma | Commercial manufacturing | Capacity, reliability, redundancy |
| Academic institutions | Translational research | Early GMP/clinical manufacturing |
| Academic medical centers | Clinical translation | Patient-specific and point-of-care capability |
| Hospitals | Therapy administration | Reliable supply and logistics |
| Research foundations | Rare-disease development | Cost-efficient development support |
| Non-profits | Unmet disease programs | Manufacturing access |
The core purchasing criteria include;
| Criterion | Importance in Buyer Decision |
| GMP compliance | Critical |
| Manufacturing capacity | Critical |
| Modality expertise | Critical |
| Product quality | Critical |
| Regulatory support | Very High |
| Analytical capability | Very High |
| Scale-up capability | Very High |
| Technology-transfer capability | Very High |
| Turnaround time | High |
| Cost | High |
| Supply-chain reliability | High |
| Cryogenic logistics | High for relevant therapies |
| Chain-of-identity | Critical for autologous therapies |
| Commercial manufacturing experience | Very High for late-stage programs |
Increasing clinical and commercial pipelines creates competition for:
For scalable manufacturing facilities and advanced bioreactor systems, expanding demand for viral vectors and cell products acts as a driver for investment.
Process variability, comparability requirements, documentation requirements, validation costs, and regulatory complexity can be introduced while moving from one manufacturing site to another.
Advanced therapies are biologically complex and can result in contamination, potency variation, yield variation, and raw-material variability.
A typical advanced-therapy manufacturing procurement process can be structured as:
1. CDMO identification
↓
2. Technical capability screening
↓
3. Modality-specific assessment
↓
4. Facility/GMP qualification
↓
5. Quality and regulatory due diligence
↓
6. Capacity assessment
↓
7. Commercial proposal
↓
8. Master service agreement
↓
9. Technology transfer
↓
10. Engineering/validation batches
↓
11. Clinical/commercial manufacturing
↓
12. Long-term supply agreement
As manufacturing itself can influence the regulatory pathway, the cycle becomes substantially more complex than conventional contract manufacturing.
| Therapy | Primary Buyer Need | Manufacturing Requirement |
| CAR-T | Patient-specific production | Cell isolation, activation, modification, expansion |
| TCR-T | Engineered immune-cell production | Genetic modification + cell expansion |
| TIL | Tumor-derived cell expansion | Isolation, expansion, characterization |
| CAR-NK | Scalable immune-cell manufacturing | Cell expansion + engineering |
| AAV | Vector production | Upstream production + purification |
| Lentiviral | Gene-modified cells | Vector production + cell modification |
| CRISPR/Cas | Gene editing | High-complexity cell/vector processing |
| Stem cell | Cell expansion | Controlled culture + characterization |
| Tissue engineering | Biomaterial/cell integration | Scaffold + cell manufacturing |
| Combined ATMP | Multiple components | Integrated manufacturing + regulatory support |
| Company Size | Large Pharmaceutical Companies | Mid-Sized Biotech | Emerging Biotech | Academic Institutions |
| Primary Priorities |
Commercial scale; |
Phase II/III manufacturing; Scale-up; Technology transfer; Cost control; Commercial-readiness |
Rapid access to GMP capacity; Flexible batch sizes; Process development; Analytical testing; Regulatory support; Reduced capital expenditure |
Translational manufacturing; Early GMP capability; Process development; Clinical material; Technology transfer |
| Manufacturing Mode | Typical Buyer | Main Reason |
| Full-Service CDMO | Emerging biotech | One-provider development-to-manufacturing model |
| Specialized CDMO | Advanced biotech/pharma | Modality expertise |
| Integrated Development & Manufacturing | Clinical-stage biotech | Minimize technology-transfer risk |
| Dedicated In-House | Large pharma | Control and strategic capacity |
| Multi-Product Facility | Biotech/CDMO | Flexibility |
| Hybrid | Mid/large biotech | Retain core IP while outsourcing capacity |
| Point-of-Care | Hospitals/academic centers | Personalized manufacturing |
Payer spending provides a useful downstream indicator, where Towards Healthcare's 2026 U.S. CGT spending analysis projects approximately US$25.6B in CGT spending, which includes
| Payer | Projected 2026 Spending |
| Commercial Insurance | US$12.2B |
| Medicare | US$8.1B |
| Medicaid | US$5.44B |
| Total | ~US$25.6B |
Why this matters to manufacturing
As higher reimbursed therapy utilization can ultimately increase:
| Market Layer | U.S. Advanced Therapy Manufacturing Opportunity |
| TAM | Entire potential manufacturing ecosystem across cell, gene, tissue-engineered, and combined advanced therapies |
| Core TAM benchmark | US$3.26B, 2025 |
| Adjacent market benchmark | US$4.09B U.S. CGT market, 2025 |
| Outsourced manufacturing SAM | US$3.14B U.S. CGT CDMO market, 2025 |
| In-house opportunity | 46.7% of U.S. CGT manufacturing mix |
| CDMO opportunity | 37.50% |
| Hybrid opportunity | 16.00% |
| SOM | Company-specific, based on modality, GMP capacity, technology, geography, and customer relationships |
| Highest-growth service opportunity | Analytical Testing & QC - 21.4% CAGR |
| Highest-growth manufacturing service | Commercial Manufacturing - 22.3% CAGR |
| Highest-growth therapy subsegment | Allogeneic Cell Therapy - 22.6% CAGR |
| Highest-growth manufacturing workflow | Cell Modification - 22.1% CAGR |
| Highest-growth manufacturing scale | Phase III Scale - 22.8% CAGR |
| Highest-growth end-user | Emerging Biotechnology Companies - 23.5% CAGR |
| Highest-growth manufacturing mode | Hybrid Manufacturing - 22.4% CAGR |
| Opportunity Pocket | Why it Matters |
| Allogeneic cell therapy | Higher scalability potential than patient-specific manufacturing |
| Gene-modified cell therapy | Integrates cell processing with genetic engineering |
| Commercial manufacturing | Approved therapies create recurring production requirements |
| Analytical testing | Increasing complexity creates specialized QC demand |
| Cell modification | Gene editing and engineered-cell platforms increase processing complexity |
| Phase III manufacturing | Programs require commercial-ready processes |
| Emerging biotech outsourcing | Companies need infrastructure without building complete facilities |
| Specialized CDMOs | Modality-specific expertise creates differentiation |
| Hybrid manufacturing | Customers retain strategic processes while outsourcing capacity |
| Cryogenic logistics | Personalized therapies require specialized product handling |
| Point-of-care manufacturing | Reduces transportation requirements for individualized products |
| Technology transfer | Enables movement from development to commercial manufacturing |
The U.S. advanced therapy manufacturing market is characterized by a large and increasingly fragmented manufacturing ecosystem and not a single manufacturing model. A total of US$3.26B in 2025 captured the core advanced-therapy manufacturing opportunity; on the other hand, the data indicates that the underlying ecosystem is already distributed across 46.7% in-house, 37.5% CDMO, and 16% hybrid manufacturing. Furthermore, the strongest structural opportunity is shifting toward commercial-scale, specialized, and modality-specific manufacturing, with 44.2% share for cell therapy, 42.1% for gene therapy, 48.6% for manufacturing services, 65.7% for contract manufacturing, 57.5% for biopharmaceutical companies, and 45% for clinical-scale manufacturing.
Areas such as allogeneic cell therapy, commercial manufacturing, analytical testing, cell modification, Phase III manufacturing, emerging-biotech outsourcing, and hybrid manufacturing are the fastest-growing portions of the ecosystem addressing current manufacturing complexity. Additionally, a major shift towards a combination of modality expertise + scalable capacity + analytical depth + regulatory support + technology-transfer capability + reliable cold-chain/chain-of-identity infrastructure beyond basic GMP capacity is reported by central buyer requirements.
Thus, these factors create the largest opportunity beyond the manufacturer with the largest physical facility to provider capable of connecting process development, GMP manufacturing, QC/release, regulatory support, and commercial-scale supply into a reliable advanced-therapy manufacturing workflow. Furthermore, expanding clinical pipelines, complex manufacturing requirements, outsourcing, capacity expansion, and advanced manufacturing technologies are recognized as the major growth drivers based on Towards Healthcare's latest U.S. CDMO analysis.
Payal Rabde, Senior Research Analyst, led the primary market research, developed the methodology, analysed trends, segmentation, competition, forecasts, and strategic opportunities, forming the report's analytical foundation.
Aman Singh, a multidisciplinary strategist, was responsible for collecting and validating clinical trial data, research publications, company information, partnerships, and other quantitative datasets, strengthening evidence-based analysis and market estimations.
Aditi Shivarkar, an expert business strategist, reviewed the complete research document, performed quality checks, validated findings, refined content, corrected inconsistencies, and finalized the report, ensuring accuracy, clarity, credibility, and publication-ready quality.
By Therapy Type/Product
By Service Type
By Development Phase
By Therapeutic Area
By End User
By Manufacturing Mode
By Manufacturing Workflow
By Manufacturing Scale


Principal Consultant
Payal Rabde is a Healthcare Market Research Analyst at Towards Healthcare Research & Consulting with 4+ years of experience in pharmaceuticals, biotechnology, medical devices, and life sciences.
Learn more about Payal Rabde

Reviewed By
Aditi Shivarkar is a seasoned professional with over 14 years of experience in healthcare market research. As a content reviewer, Aditi ensures the quality and accuracy of all market insights and data presented by the research team.
Learn more about Aditi Shivarkar