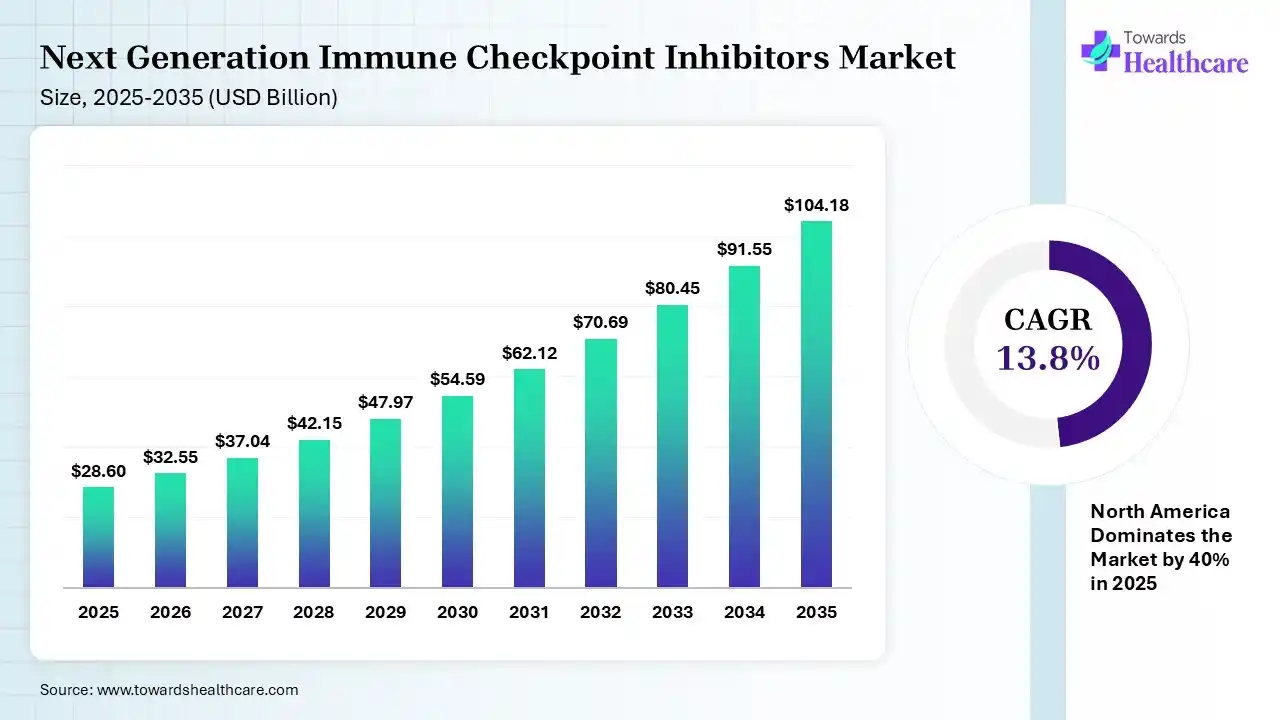
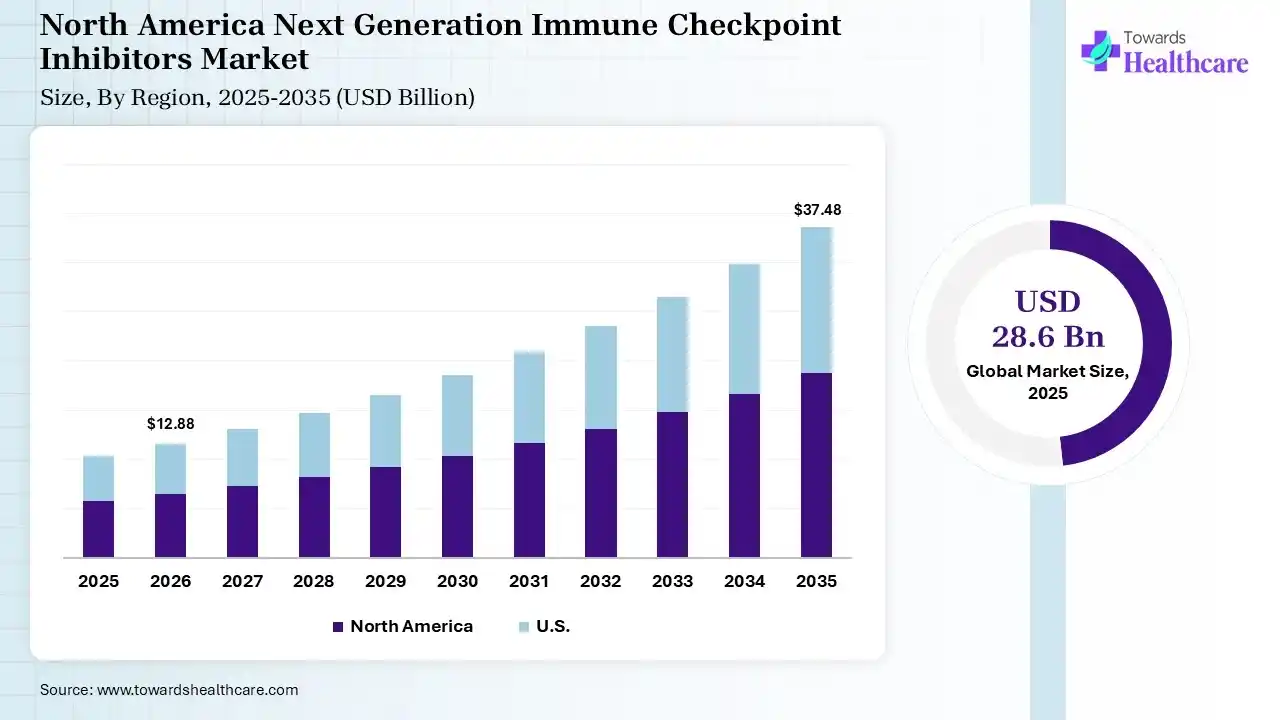
The global next-generation immune checkpoint inhibitors market size was estimated at USD 28.6 billion in 2025 and is predicted to increase from USD 32.55 billion in 2026 to approximately USD 104.18 billion by 2035, expanding at a CAGR of 13.8% from 2026 to 2035. The growing incidence of cancer globally is increasing the adoption of next-generation immune checkpoint inhibitors. Growing R&D activities, expanding healthcare, technological advancements, and new product launches are also enhancing the market growth.
")
The next-generation immune checkpoint inhibitors market is driven by growing demand to overcome the limitations of the first-generation therapies. The next generation of immune checkpoint inhibitors refers to the advanced immunotherapy drugs targeting new immune checkpoints to enhance the immune response to recognize and kill cancer cells. They are used for the treatment of various cancer types, such as lung, bladder, melanoma, and breast cancer.
AI is being used in the next-generation immune checkpoint inhibitors market for biomarker discovery and new drug target identification. It is also used in drug design, enhancing drug binding affinity, and combination therapy planning. AI also helps in toxicity prediction, tumor microenvironment analysis, and clinical trial optimization.
Expanding Precision Immunotherapy
The growing health awareness is increasing the adoption of precision immunotherapies. This is increasing the next generation of immune checkpoint inhibitor integration with biomarker and genomics to improve patient outcomes.
Focus On Next-Generation Targets
Growing R&D activities are driving the discovery of new checkpoints such as LAG-3, TIM-3, and TIGIT. This is driving the development of novel checkpoint inhibitors.
Expanding Innovations
Increasing advancements in next-generation immune checkpoint inhibitors are promoting the development of combination therapies and new technologies. Expanding applications and faster regulatory approvals are also increasing their innovations.
| Table | Scope |
| Market Size in 2026 | USD 32.55 Billion |
| Projected Market Size in 2035 | USD 104.18 Billion |
| CAGR (2026 - 2035) | 13.8% |
| Leading Region | North America by 40% |
| Historical Data | 2020 - 2023 |
| Base Year | 2025 |
| Forecast Period | 2026 - 2035 |
| Measurable Values | USD Millions/Units/Volume |
| Market Segmentation | By Target Type, By Drug Class, By Therapy Type, By Indication, By End User, By Region |
| Top Key Players | Merck & Co., Regeneron, Bristol Myers Squibb, BeiGene, Roche, Gilead Sciences, AstraZeneca, Pfizer, Novartis, GSK |
")
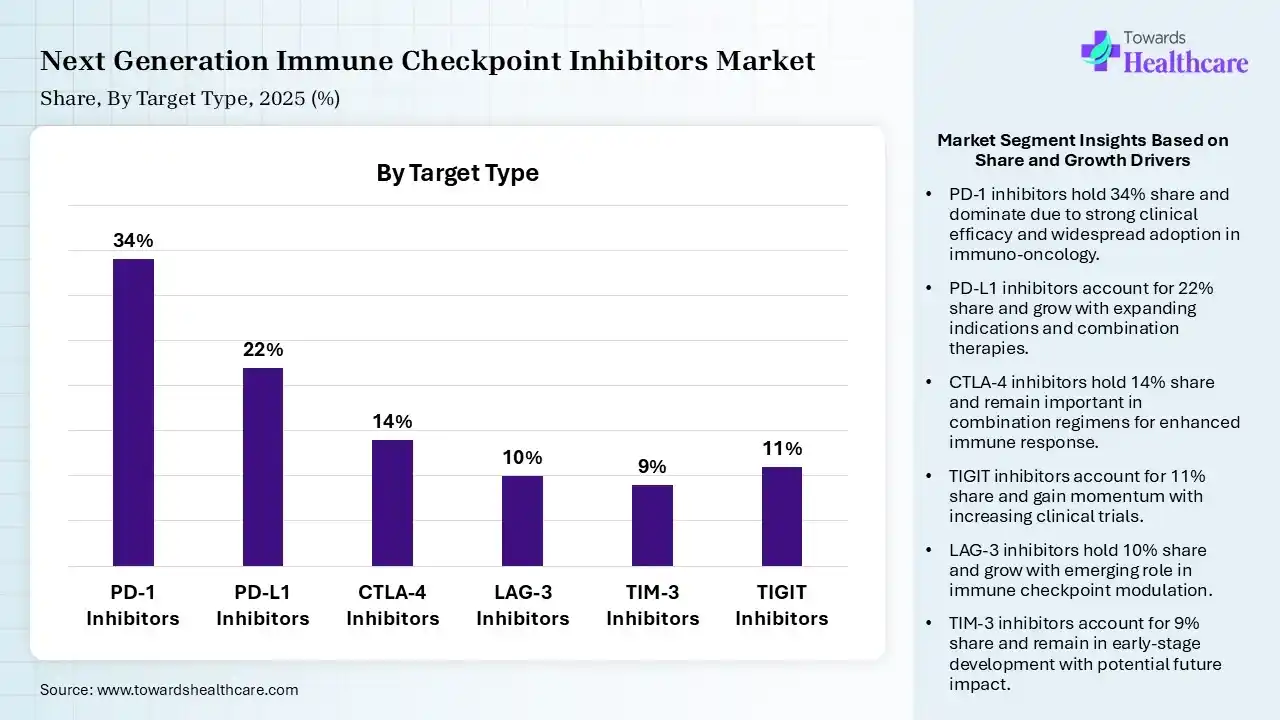
| Segment | Share 2025 (%) |
| PD-1 Inhibitors | 34% |
| PD-L1 Inhibitors | 22% |
| CTLA-4 Inhibitors | 14% |
| LAG-3 Inhibitors | 10% |
| TIM-3 Inhibitors | 9% |
| TIGIT Inhibitors | 11% |
The PD-1 Inhibitors Segment Dominated the Market With 34% in 2025
The PD-1 inhibitors segment led the next-generation immune checkpoint inhibitors market with 34% share in 2025, due to strong clinical validation across multiple cancers. Expansion in the approval rates also increased their usage. High physician familiarity also sustained their demand.
The PD-L1 inhibitors segment held the second-largest share of 22% of the market in 2025, driven by increasing use in combination regimens. Favorable safety profiles also encourage their broader usage. Biomarker-driven therapies enhance targeting efficiency, increasing their use.
The CTLA-4 inhibitors segment held 14% of the next-generation immune checkpoint inhibitors market share in 2025, due to the combination therapy applications, which sustain their relevance. Proven efficacy in melanoma also supports their demand. Pipeline innovations are also improving their tolerability, driving their adoption.
The LAG-3 inhibitors segment held 10% of the market share in 2025 and is expected to witness the fastest growth during the forecast period, due to recent approvals driving rapid market entry. Strong synergy with PD-1 inhibitors accelerates their adoption. Increasing clinical trials and expanding indications are also increasing their use.
")
| Segment | Share 2025 (%) |
| Monoclonal Antibodies | 52% |
| Bispecific Antibodies | 18% |
| Small Molecules | 9% |
| Fusion Proteins | 11% |
| ADCs | 10% |
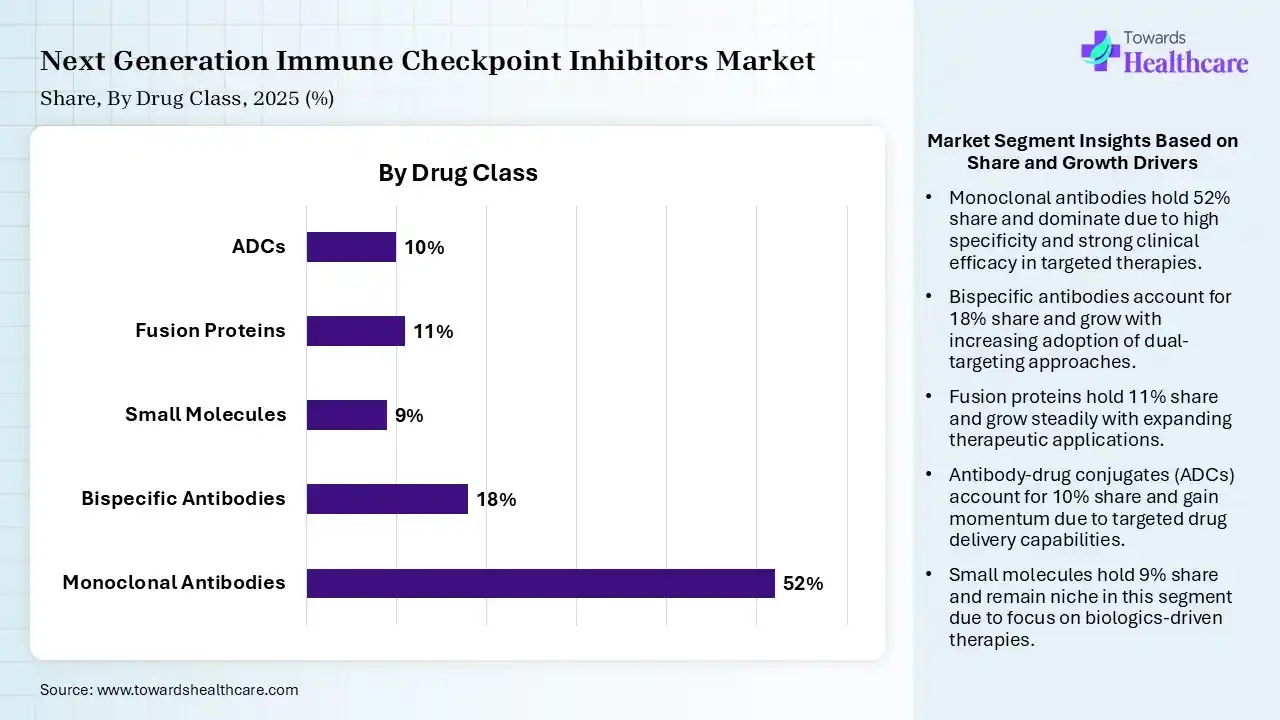
The Monoclonal Antibodies Segment Dominated the Market With 52% in 2025
The monoclonal antibodies segment accounted for the highest revenue share of 52% of the next-generation immune checkpoint inhibitors market in 2025, due to established efficacy, which ensured their widespread clinical use. Strong regulatory approvals also supported their dominance. An extensive pipeline sustained their innovations.
The bispecific antibodies segment held the second-largest share of 18% of the market in 2025 and is expected to show the highest growth with a CAGR during the forecast period, due to dual-target mechanisms. Rising R&D investments are also accelerating their approvals. Growing interest in precision oncology also fuels their demand.
The fusion proteins segment held 11% of the next-generation immune checkpoint inhibitors market share in 2025, due to novel mechanisms providing differentiation. Increasing collaborations also boost their development. Improved pharmacokinetics, enhancing their effectiveness, also drives their adoption.
The antibody-drug conjugates (ADCs) segment held 10% of the market share in 2025, due to their targeted delivery, which reduces toxicity. Increasing oncology applications also increase their demand. Technological advancements are improving their efficacy, driving their adoption rates.
")
| Segment | Share 2025 (%) |
| Monotherapy | 38% |
| Combination Therapy | 62% |
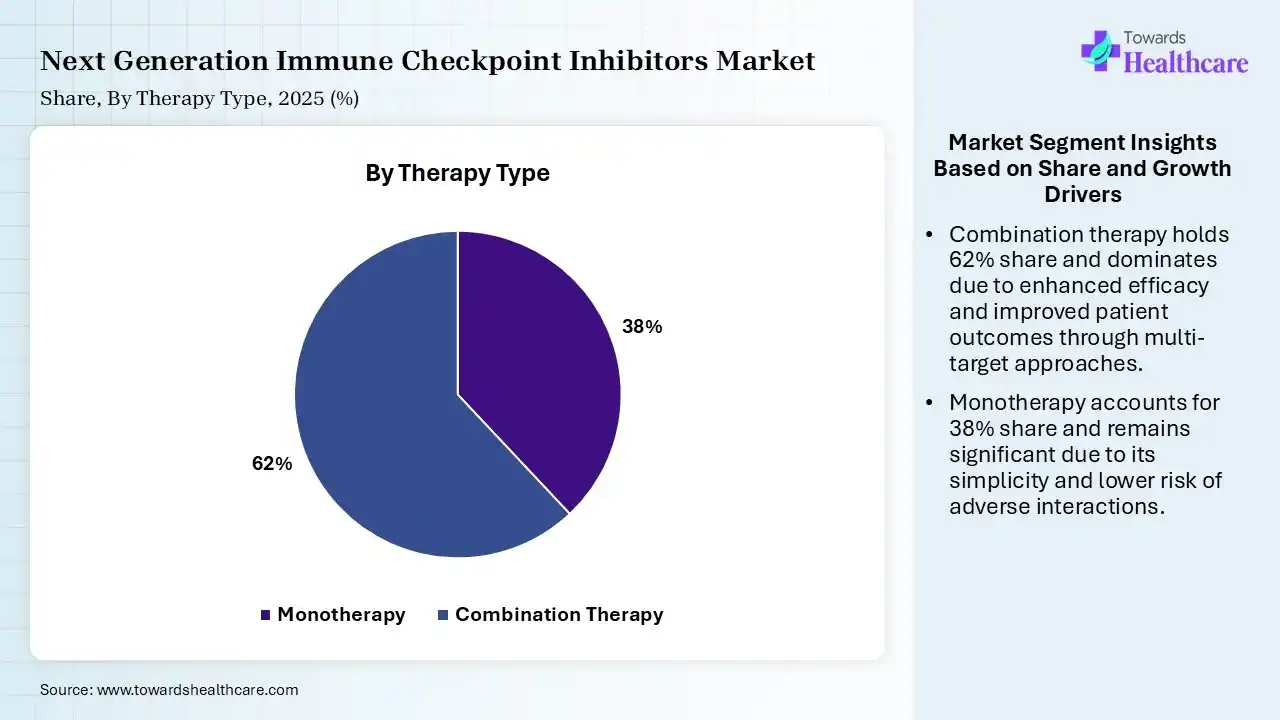
The Combination Therapy Segment Dominated the Market With 62% in 2025
The combination therapy segment held a major revenue share of 62% of the next-generation immune checkpoint inhibitors market in 2025 and is expected to expand rapidly during the forecast period, due to superior efficacy, which enhanced their clinical preference. Expanding combinations also improved outcomes. Personalized treatment strategies also increased their demand.
The monotherapy segment held the second-largest share of 38% of the market in 2025, due to its simplicity in treatment protocols, which drives its use. Lower toxicity also supports their adoption. Established approvals also maintain their steady demand.
")
| Segment | Share 2025 (%) |
| Lung Cancer | 30% |
| Melanoma | 16% |
| Renal Cell Carcinoma | 12% |
| Head & Neck Cancer | 10% |
| Bladder Cancer | 9% |
| Breast Cancer | 11% |
| Others | 12% |
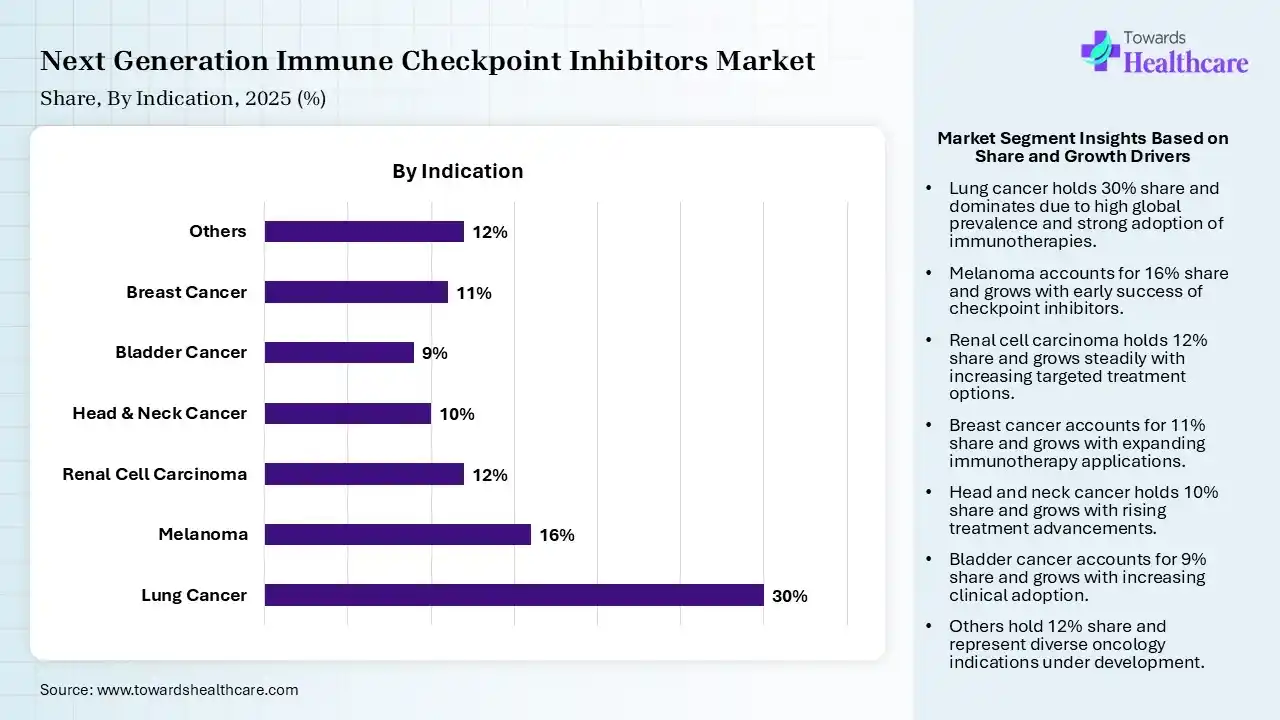
The Lung Cancer Segment Dominated the Market With 30% in 2025
The lung cancer segment contributed the biggest revenue share of 30% of the next-generation immune checkpoint inhibitors market in 2025, due to their high prevalence. Strong clinical evidence of next-generation immune checkpoint inhibitors also supported their usage. Continuous drug approvals also expanded their treatment options.
The melanoma segment held the second-largest share of 16% of the market in 2025, driven by the early success of immunotherapy. High responsiveness also supports their continued usage. Combination therapies improve survival rates, which also contributes to their increased demand.
The renal cell carcinoma segment held 12% of the next-generation immune checkpoint inhibitors market share in 2025, due to increasing adoption of combination therapies. Favorable outcomes of next-generation immune checkpoint inhibitors also boost physician confidence. Expanding research is also enhancing treatment options.
The breast cancer segment held 11% of the market share in 2025 and is expected to gain the highest CAGR during the forecast period, due to the expanding role of immunotherapy. Rising clinical trials are also supporting their adoption. Targeted therapies enhance effectiveness, fueling their demand.
")
| Segment | Share 2025 (%) |
| Hospitals | 58% |
| Specialty Cancer Clinics | 24% |
| Research Institutes | 10% |
| Ambulatory Surgical Centers | 8% |
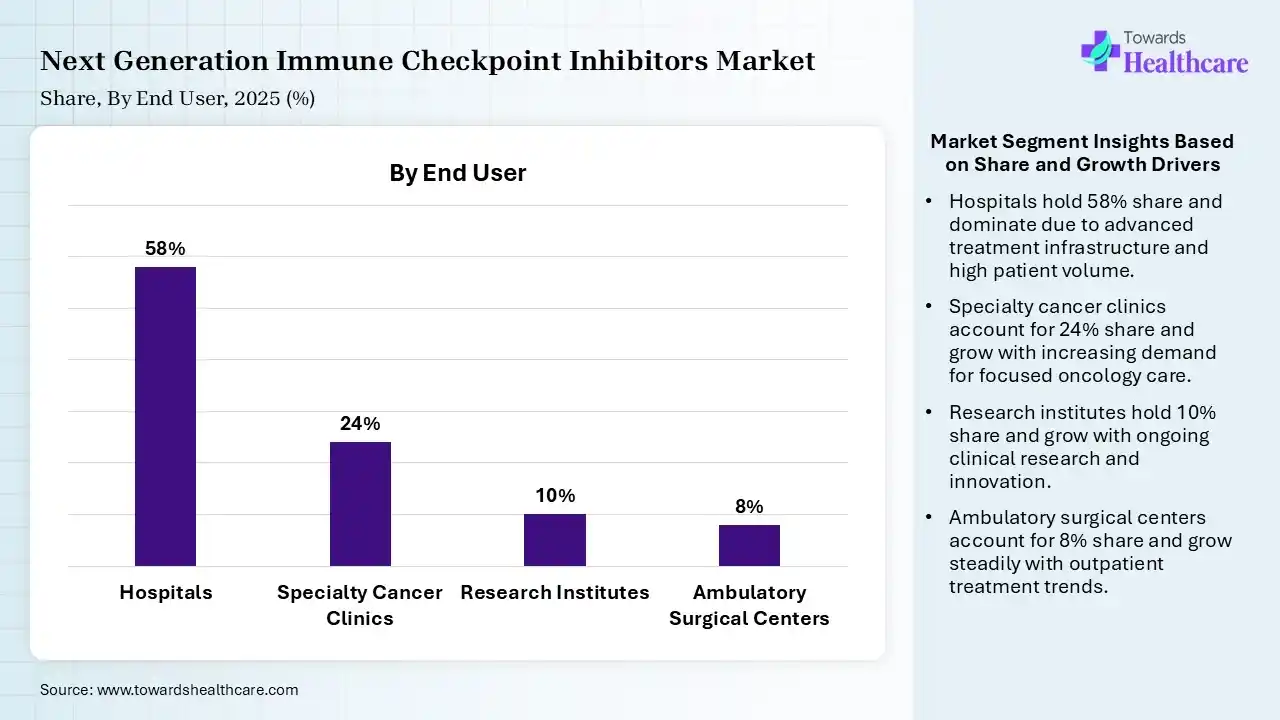
The Hospitals Segment Dominated the Market With 58% in 2025
The hospitals segment held the largest revenue share of 58% of the next-generation immune checkpoint inhibitors market in 2025, driven by advanced infrastructure, which supported the adoption of complex treatments. High patient inflow also increased the demand for next-generation immune checkpoint inhibitors. Access to multidisciplinary care also increased their use.
The specialty cancer clinics segment held the second-largest share of 24% of the market in 2025 and is expected to grow with the fastest CAGR during the forecast period, due to focused oncology care improving treatment efficiency. Rising outpatient treatments also boost their demand. Increasing private investments also support their growth.
The research institutes segment held 10% of the next-generation immune checkpoint inhibitors market share in 2025, due to high clinical trials, which drive their usage. Government funding also supports next-generation immune checkpoint inhibitor research. Innovation pipelines also enhance their demand.
The ambulatory surgical centers segment held 8% of the market share in 2025, driven by their cost-effective care, which attracts patients. Increasing minimally invasive treatments is also increasing their adoption. Expanding healthcare infrastructure also supports their growth.
")

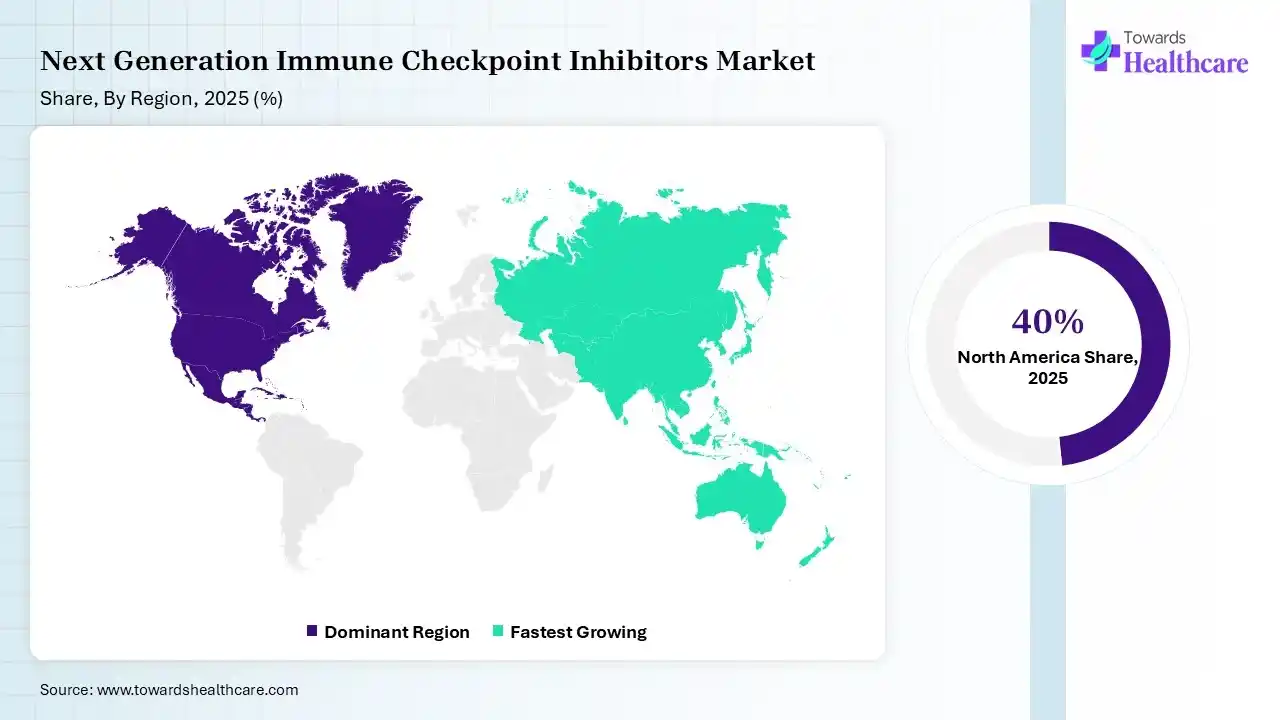
North America dominated the next-generation immune checkpoint inhibitors market with 40% in 2025, due to the strong presence of key players. This increased the next generation of immune checkpoint inhibitor innovations, where high healthcare costs also supported their adoption. Favorable reimbursement policies also contributed to the market growth. Furthermore, the market is driven by high cancer prevalence, advanced healthcare infrastructure, and rapid FDA approvals for combination therapies. Key drivers include the proven efficacy of PD-1/PD-L1 inhibitors, heavy R&D investment, and favorable reimbursement policies.
U.S. Market Trends
Advanced oncology infrastructure in the U.S. drives the demand for next-generation immune checkpoint inhibitors. Rapid drug approvals also enhance their adoption rates. High cancer prevalence and rising health awareness also support their growth. Key drivers include the need to address resistance to first-generation drugs, the growing demand for personalized medicine, and advanced healthcare infrastructure for clinical trials.
Asia Pacific held 22% share of the next-generation immune checkpoint inhibitors market in 2025 and is expected to grow at the fastest CAGR during the forecast period, due to rapid healthcare expansion, which drives adoption. Rising cancer burden also boosts their demand. Increasing investments in biotech accelerate their innovations, enhancing the market growth. Key drivers include accelerating clinical trials, localized drug manufacturing, and strategic regulatory approvals, particularly in China and India.
India Market Trends
The market in India is driven by the rising cancer incidence, increasing adoption of advanced combination therapies, and improved accessibility to precision medicine. Key drivers include high efficacy in treating advanced cancers and the expansion of clinical trials to improve patient survival rates. Expanding healthcare access boosts the adoption of next-generation immune checkpoint inhibitors across India. Rising awareness drives early diagnosis, which also boosts their demand. Increasing investments also support their adoption rates and innovations.
R&D
Clinical Trials and Regulatory Approvals
Patient Support and Services

| Companies | Headquarters | Next Generation Immune Checkpoint Inhibitors |
| Merck & Co. | Rahway, U.S. | LAG-3, PD-1, and TIGIT |
| Regeneron | Tarrytown, U.S. | GITR and LAG-3 |
| Bristol Myers Squibb | Princeton, U.S. | LAG-3, TIGIT, and TIM-3 |
| BeiGene | Beijing, China | LAG-3 and TIGIT |
| Roche | Basel, Switzerland | TIGIT and next-gen combinations |
| Gilead Sciences | Foster City, U.S. | TIGIT and CD47 |
| AstraZeneca | Cambridge, UK | TIGIT, Bispecific Antibodies, and NKG2A |
| Pfizer | New York, U.S. | CCR-2 |
| Novartis | Basel, Switzerland | LAG-3 and TIM-3 |
| GSK | London, UK | TIGIT |
Strengths
Weaknesses
Opportunities
Threats
By Target Type
By Drug Class
By Therapy Type
By Indication
By End User
By Region

Principal Consultant
Shivani Zoting is a dedicated research analyst specializing in the healthcare industry. With a strong academic foundation, a B.Sc. in Biotechnology and an MBA in Pharmabiotechnology, she brings a unique blend of scientific understanding and strategy.
Learn more about Shivani Zoting
Reviewed By
Aditi Shivarkar is a seasoned professional with over 14 years of experience in healthcare market research. As a content reviewer, Aditi ensures the quality and accuracy of all market insights and data presented by the research team.
Learn more about Aditi Shivarkar